
HP StorageWorks P9000 Performance Advisor Software v5.3 User and Troubleshooting Guide (T1789-96322, August 2011)

The forecast utilization can be monitored for a day, week, month, six months, or year based on the
current data points. For example, if you have data points for a RAID group collected over two days
and you want to forecast its utilization for the next one week, P9000 Performance Advisor forecasts
the utilization rate based on the data collected over two days.
• For an XP disk array, the forecasted utilization value for the DKA, MP, RAID group, and the cache
write pending utilization is measured against the default or threshold values that are set on the
Threshold Settings screen.
• For a P9000 disk array, the forecasted utilization value for the RAID group, MP blade, and the
cache write pending utilization is measured against the default or threshold values that are set on
the Threshold Settings screen.
For more information, see “Configuring dashboard threshold settings” on page 122.
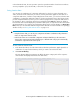
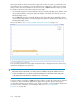
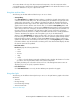
In the preceding utilization forecast graph, the threshold value is displayed as a blue reference line
and the forecast appears as a green line.
IMPORTANT:
• Ensure that at least a minimum of 21 data points are available to begin the utilization forecast.
• To forecast utilization for a week, HP recommends that there be a minimum of 250 data points
or the performance data has been collected for two or more days.
To forecast a ThP pool utilization, P9000 Performance Advisor considers the existing rate of utilization
of a ThP pool. Then, it extends the performance graph of the respective ThP pool to project the
corresponding utilization for the next day, week, month, six months, or year, based the duration that
you select. For more information on forecasting for ThP pools, see “Forecasting THP's
performance” on page 463.
Using charts318