
HP StorageWorks P9000 Performance Advisor Software v5.3 User and Troubleshooting Guide (T1789-96322, August 2011)
To forecast utilization for any of the above-mentioned components, select the component and its
corresponding metric, and select the duration from the Forecast list in the Chart Work Area. You can
forecast the utilization for only one component at a time.
Using date and time filters
The following are the date and time filters that you can use on charts:
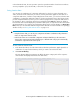
• Start Updating:
Click Start Updating for P9000 Performance Advisor to update the selected chart window every
5 minutes with the newest data points. The newest data points are added to the right side of the
graphs in the chart window. It is in addition to the data points that are already plotted for the
specified date and time range. All the other data points are shifted one column to the left of the
graphs. The five minutes duration starts from the time you clicked the Start Updating button and
based on the system time where you are accessing P9000 Performance Advisor. If the performance
data is being collected for a frequency less than 5 minutes, all the data points accumulated over
the past 5 minutes are displayed. If the performance data is being collected for a frequency
greater than 5 minutes, there are no data points available when the chart is initially updated for
5 minutes. The data points appear in the next update cycle only for the delta duration.
When you click Start Updating, the chart re-renders itself to show the new values that are collected
from the host agent. The Start Time displays the time when the automatic update started, and the
End Time displays Continuous Update. It implies that P9000 Performance Advisor continuously
updates the chart with the newest data points till the time you click Stop Updating. Then, P9000
Performance Advisor stops the automatic re-rendering of the chart. The End Time displays the time
till when the chart was last updated.
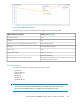
• Date/Time Filters:
Duration displays the following date filters:
• 1 hour
• 6 hours
• 12 hours
• 1 day
• 1 week
• ...: Click to select the duration (start and end date) from the calendar. The duration is for when
you want to view the performance data of the selected components.
By default, the data points collected in the last one hour of the management station's time are
displayed, if you do not specify a particular duration.
• Last 10 Collections:
Click Last 10 Collections to view only the last 10 data points plotted in the graph.
Using chart Styles
The following are the different chart styles that you can use on the performance graphs in the Chart
Work Area:
• Time Line
• Moving Average
• Line Plus Moving Average
• Time Line No Breaks
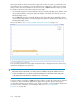
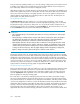
Time Line Chart Style
HP StorageWorks P9000 Performance Advisor Software User Guide 319