
HP StorageWorks P9000 Performance Advisor Software v5.3 User and Troubleshooting Guide (T1789-96322, August 2011)


the data collection resumes, the data points and the average values are again plotted simultaneously
for the selected components.
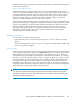
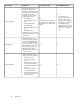
Time Line No Breaks Chart Style
The Time Line No Breaks chart style enables you to view the actual performance of the selected
components irrespective of whether the data collection is active or discontinued. Using this style, view
a complete graph that includes the data points plotted when the data collection is active, and the
performance trend of the selected components when the data collection is discontinued. From the
Time Line No Breaks graph, you can visualize the pattern in which the data points be plotted
irrespective of whether the data collection is active or discontinued.
The data points are plotted simultaneously when the data collection is in progress. If the data collection
fails for a particular duration, a straight line is displayed for that duration, indicating a failure in data
collection. The straight line joins the last data point that is plotted before the data collection failed
and the first data point that is plotted after the data collection resumed. This provides you an
approximate idea of the performance of components if the data collection was active during the
specified time interval. Once the data collection resumes, the data points are again plotted
simultaneously for the selected components.
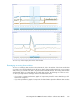
Zooming in on charts
You can zoom in on charts in the following ways:
• Horizontal zoom, where you use the Zoom preview panel to zoom in on charts for a selected
duration
• Vertical and horizontal zoom, where you zoom in on charts for a specified duration and also data
points across performance graphs
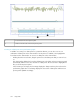
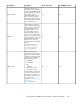
Previewing charts
The Zoom preview panel provides a preview to the performance data displayed for a selected duration
in the respective chart window. It appears if the Show Zoom check box is selected in the Chart Work
Area, and occupies the lower pane of a chart window. It has sliders that you can use to filter the
overall duration in the chart window and view data for a particular focused duration. You can drag
the sliders on either side of the time scale to increase or decrease the duration for which you want to
view the data points. The existing chart window are accordingly updated to display data points for
the duration selected in the Zoom preview panel. The focused area in the Zoom preview panel is
highlighted in blue. It displays the section of the chart window that you are currently viewing in the
Zoom preview panel. The Zoom preview panel is always in sync with its chart window and dynamically
updated whenever you change the duration in the chart window.
IMPORTANT:
You can preview the data in the Zoom preview panel only for the duration selected in the respective
chart window. The preview is for the entire chart window and covers all the data points plotted in the
chart window for the selected duration.
HP StorageWorks P9000 Performance Advisor Software User Guide 321