
HP StorageWorks P9000 Performance Advisor Software v5.3 User and Troubleshooting Guide (T1789-96322, August 2011)
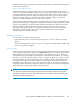


Focused area in the Zoom preview panel1
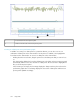
Sliders on the time scale in the Zoom preview panel2
Zooming in on data points across performance graphs
In addition to zooming in on data points for a particular duration, you can also zoom in on a
combination of data points in the chart window. If zoom preview is enabled, it also highlights the
focused area in the chart window. To zoom in on data points in the chart window:
• Holding down the mouse button, drag the pointer across the data points that you want to focus
on.
The chart window displays the focused set of data points. The sliders on the Zoom preview panel
automatically shift the focus to the selected set of data points. The focused area is highlighted in
blue, in the Zoom preview panel.
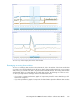
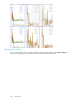
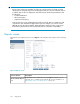
In the following set of images, the first image displays the data points being focused across the
performance graphs. The second image displays the focused set of data points with the Zoom
preview panel updated accordingly.
Using charts322