
HP StorageWorks P9000 Performance Advisor Software v5.3 User and Troubleshooting Guide (T1789-96322, August 2011)


IMPORTANT:
• Reports on the following are available only if they are configured in the selected XP or P9000
disk array. If not configured, they are not even displayed as options to select for create their reports.
In addition, they are also not displayed in other related reports, like the Array Performance and
the All reports.
• Journal Pool Utilization
• ThP Pool Occupancy
• Snapshot Pool Occupancy
• In the report that you create, P9000 Performance Advisor plots the data for a maximum of eight
components in each chart that is displayed in the report. For example, if you want to view the
LDEV IO report for the 64 busiest LDEVs, P9000 Performance Advisor provides a single report
that includes eight charts. Each chart accommodates data for a maximum of eight LDEVs.
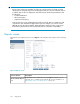
Reports screen
The Reports screen appears when you click Reports in the left pane and comprises of the following
tabs:
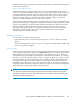
Figure 29 Reports screen
.
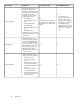
DescriptionScreen elements
By default, this tab is enabled when you click Reports in left pane. You can
generate, save, or schedule reports under this tab. For more information, see
“Generating, saving, or scheduling reports” on page 331.
Create/Schedule Reports
tab
Using reports330