
HP StorageWorks P9000 Performance Advisor Software v5.3 User and Troubleshooting Guide (T1789-96322, August 2011)
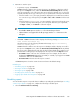

4. Click Save. P9000 Performance Advisor does the following:
• Saves the schedule and also displays a record for the schedule in the Scheduled Reports
section, under the View Created/Scheduled Reports tab. The following details along with
those you provided while scheduling a report are displayed for that schedule in the Scheduled
Reports section:
• Occurrence: Displays number of times a particular schedule is repeated. The occurrence
is aligned to the selected schedule frequency. In addition, this column also displays the
selected schedule frequency and the start time. The format displayed is <schedule fre-
quency> at <start time> (for example, Every Wednesday at 11:00 hrs).
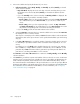
• Schedule Time: Displays the time when you created the schedule.
• End Time: Displays the end date and time for the schedule. P9000 Performance Advisor
calculates the end time based on the start time and the number of occurrences that you
specify.
For example, if Occurrence displays Every Wednesday at 11:00 hrs for a schedule record
and the End Time displays 09.24.2008 11:00:00, it implies that the schedule repeats every
Wednesday at 11:00 a.m. for three consecutive weeks and ends on 09.24.2008 at
11:00 hours for the last time, before it is automatically deleted.
• Email Dest: Displays the email address that you provided (applicable only when you
schedule a report).
If the email address is not provided or is invalid, you will not receive any notification
though the report is generated. You need to go to the following location and select the
report you want to view: <Local_drive>:\HPSS\Tomcat\Webapps\PA\Reports.
All the reports are available in this location. (Local drive on the management station refers
to the C drive, where the Windows operating system is installed, and the HPSS folder is
also copied to the C drive).
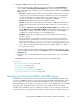
• As per the specified start time and schedule frequency, P9000 Performance Advisor creates
a report and adds a record for that report in the Reports section, under the View Created/Sched-
uled Reports tab.
• Provides the report as a file attachment to the email notification that is sent to the intended
recipients.
Click Reset anytime to clear the current selections and restore the default settings.
Related Topics
• “Generating or saving reports” on page 334
• “Viewing a report” on page 340
• “Viewing a schedule” on page 342
• “Creating reports for favorite charts” on page 313
• “Logging report details and exceptions” on page 344
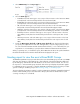
Creating report for busiest LDEVs and RAID groups
The LDEV IO report provides data on the busiest frontend and the backend LDEVs and RAID groups
on an XP or a P9000 disk array. It is based on the frontend I/Os and the backend transfers. You can
view the report for 8 - 128 busiest frontend and backend LDEVs, and 8 - 32 busiest frontend and
backend RAID groups. The port type, such as Fibre, Ficon, Escon, or FCoE (applicable only for P9000
disk arrays) is also displayed beside the port ID, which is associated with the particular LDEV.
The RAID groups and LDEVs selection is in multiples of eight. If you do not select any value from the
respective drop-down lists, by default, the LDEV IO report is generated for the eight busiest frontend
HP StorageWorks P9000 Performance Advisor Software User Guide 337