
HP StorageWorks P9000 Performance Advisor Software v5.3 User and Troubleshooting Guide (T1789-96322, August 2011)
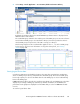


4. Click Settings > Launch Application > Session Name (default: Performance Advisor).
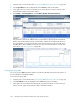
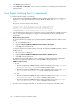
By default, the utilization data for the Overall RAID Group utilization metric is displayed in the
Utilization Metrics chart window.
The overall RAID group utilization is the total busy rate of the RAID group over an entire collection
interval. When a RAID group is associated with a ThP pool, this metric provides the extent to
which a RAID group is busy because of the I/Os occurring on a ThP pool.
The following image shows the overall utilization graphs for the 1-1, 1-2, and 1-3 RAID groups
for the past one week. For more information on using other chart options, see “Viewing
charts” on page 301.
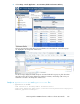
Viewing Logical Device data
Consider two RAID groups (preferably belonging to the same drive type) that have an imbalance,
where one RAID group is less busy compared to the other RAID group. The less busier RAID group
has enough capacity. You can relocate LDEVs from the other RAID group to ensure load balancing
between the RAID groups.
P9000 Performance Advisor provides the overall average utilization for each RAID group, which also
displays the percentage of RAID group utilization by an LDEV. In addition, the Total LDEV I/O
performance metric graphs are displayed for all the LDEVs that you select in P9000 Remote Web
Console.
To view the logical device data:
HP StorageWorks P9000 Performance Advisor Software User Guide 381