
HP StorageWorks P9000 Performance Advisor Software v5.3 User and Troubleshooting Guide (T1789-96322, August 2011)


1. Complete steps 1 and 2 mentioned for “Launching P9000 Performance Advisor” on page 377.
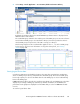
2. Select Logical Devices in the list displayed for the P9000 disk array serial number.
3. In the right work area, select the Logical Device record for which you want to view the usage
and performance data in Performance Advisor.
4. Click Settings > Launch Application > Session Name (default: Performance Advisor).
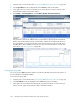
The performance data for the LDEV Total IO - Frontend metric is displayed in the Frontend IO
Metrics chart window. LDEV Total IO - Frontend metric indicates the total frontend I/O rate on
the selected LDEV over a particular duration. The following image shows the total I/O rate on
the LDEVs, 0:81, 0:82. and 0:83 for the past one week. For more information on using other
chart options, see “Viewing charts” on page 301.
Viewing host group data
For a host group, P9000 Performance Advisor provides the I/O, MB, and response time metrics on
the associated port and individual LDEVs.
To view the host group data:
1. Complete steps 1 and 2 mentioned for “Launching P9000 Performance Advisor” on page 377.
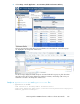
2. Select Host Groups in the list displayed for the P9000 disk array serial number.
3. In the right work area under the Host Groups tab, select the Host Group record for which you
want to view the usage and performance data in Performance Advisor.
Launching P9000 Performance Advisor from other Storage products382