
HP StorageWorks P9000 Performance Advisor Software v5.4 User Guide (T1789-96328, April 2012)
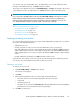


3. Enter the threshold value.
When you set the threshold limits, P9000 Performance Advisor verifies the usage of components
against the set threshold limits. Accordingly, the appropriate status icons and the average usage
summary values are displayed on the Dashboard screen.
• If you have not set the threshold limit or if you do not want to view the XP or P9000 disk array
overall usage data for a particular category, enter –1 or 0 in the metric text box.
• If the threshold limit is set to –1, - (dash) is retained in the metric text box.
• If the threshold limit is set to 0, the same is retained in the metric text box.
• If the threshold limit is not set or if it is set and later deleted without entering any value, -
(dash) appears in the metric text box.
IMPORTANT:
• Use integers as threshold values, not decimal numbers.
• You can specify the threshold limit for individual categories or for all the categories
based on the requirement. There is no maximum limit on the threshold limits.
P9000 Performance Advisor displays the default threshold values for the following metrics. You
can retain these values or enter new values for your environment:
• CHA Util (%): 70%
• Write Pending (%): 28%
• DKA Util (%): 70%
• RG Util (%): 50%
• MP Blade Util (%): 70%
The MP Blade Util (%) metric is applicable only for the P9000 disk arrays. So, the (Not
Applicable) status icon appears for the XP disk arrays in the MP Blade category on the
Dashboard screen.
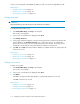
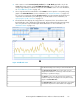
4. Select the threshold duration as 6 hrs, 12 hrs, or 24 hrs. By default, the duration is set to 6 hrs.
The threshold duration is considered for all those categories, for which the threshold limits are
set. It is not applicable individually for the Frontend, Cache, Backend, or the MP Blade category.
For example, a threshold duration of 6 hours for a P9500 Disk Array is considered by P9000
Performance Advisor to monitor the usage of components in those categories whose corresponding
threshold limits are set.
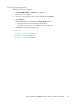
5. Click Save.
For the selected threshold duration, P9000 Performance Advisor does the following:
1. Collects the point in time and the average usage values of the individual components for the
corresponding metrics.
2. Verifies the values for a component with the respective threshold values.
3. Displays the appropriate status icons in the Frontend, Cache, Backend, or the MP Blade category
(applicable only for the P9000 disk arrays) on the Dashboard screen. Click a status icon to view
the average usage summary of individual components in that category. For more information on
Dashboard, see “Viewing dashboard” on page 124.
If the threshold limits are not set for a particular category, P9000 Performance Advisor does not
verify the usage summary of components in that category and displays the (Disabled) status
icon on the Dashboard screen for that category. To view the overall usage status of the XP and
Monitoring performance of XP and P9000 disk arrays120