
HP StorageWorks P9000 Performance Advisor Software v5.4 User Guide (T1789-96328, April 2012)


9 Viewing XP and P9000 disk array
components
This chapter discusses the following topics:
• “Introduction” on page 191
• “Viewing performance summary” on page 196
• “Viewing XP and P9000 disk array summary” on page 201
• “Volume Information” on page 202
• “Advisory on CLPR utilization” on page 205
• “Viewing CHIP/CHA data” on page 205
• “Viewing ACP/DKA data” on page 210
• “Viewing MP blade utilization for P9000 disk arrays” on page 214
• “Viewing Smart and ThP pools data for P9000 disk arrays” on page 217
• Viewing continuous access data for P9000 disk arrays
• “Utilization Summary” on page 203
• “10 busiest LDEVs/Ports” on page 228
• “10 busiest LDEVs/RAID groups” on page 229
• “RAID Group summary” on page 231
• “Port summary” on page 233
• “Viewing LDEV data” on page 236
Introduction
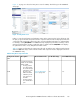
P9000 Performance Advisor provides the overall configuration, performance, and utilization summary
of the XP and the P9000 disk arrays on the Array View screen (see Figure 11 on page 193). The data
is displayed from the last performance data collection time stamp and includes the following:
• The configuration and component distribution summary.
• The performance summary, which includes the average performance of the frontend and the
backend components, Cache, and CLPR for an XP disk array.
In addition to the above-mentioned, the continuous access data and average utilization of each
MP blade is also displayed for a P9000 disk array.
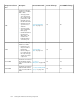
• The utilization summary, which includes the total utilization of the Cache, Bus (cache memory and
shared memory), ACP, and the CHIP for an XP disk array.
The utilization summary for a P9000 array includes the total utilization of the Cache, Bus (cache
memory and shared memory), and the MP blade.
From the high level summary, you can further drill down to view the performance data of the individual
CHIPs or CHAs, ACPs or DKAs, MP blades, LDEVs, RAID groups, ports, ThP and smart pools.
HP StorageWorks P9000 Performance Advisor Software User Guide 191