
HP StorageWorks P9000 Performance Advisor Software v5.4 User Guide (T1789-96328, April 2012)
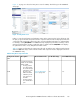

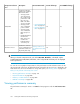
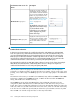

The following table describes the Performance View screen elements. The images shown are for
53036, which belongs to the P9500 Disk Array type.
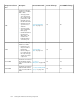
DescriptionPerformance View screen ele-
ments
• DKC Time: Displays the time
stamp of the latest DKC perform-
ance data collection
• RAID Group Time: Displays the
time stamp of the latest RAID
group performance data collec-
tion
• Port Time: Displays the time
stamp of the latest port perform-
ance data collection
Click General to view the XP or the
P9000 disk array utilization
summary. For more information, see
“Utilization Summary” on page 203.
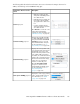
General group box
Displays the total I/Os and MB/s
on all the CHIP/CHA ports in the
array frontend. Click the Frontend
Total Avg group box to view the
busiest frontend LDEVs and ports.
For more information, see “10
busiest LDEVs/Ports” on page 228.
Frontend Total Avg group box
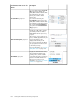
Displays the total sequential reads,
non-sequential reads and writes for
all the RAID groups in the array
backend. The array backend is the
sum of all the ACP pair activities.
In addition, the combined backend
transfer value is displayed (only for
XP24000 and P9000 disk arrays),
which is the sum of backend
transfers on all the ThP pools.
Click the Array Backend Total
group box to view the busiest
backend LDEVs and RAID groups.
For more information, see “10
busiest LDEVs/RAID
groups” on page 229.
Backend Total Avg group box
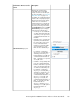
Displays the cache usage, pending
writes, and the sidefile usage. For
more information, see “Cache
usage chart” on page 204.
Cache [Total - ### MB] group box
HP StorageWorks P9000 Performance Advisor Software User Guide 197