
HP StorageWorks P9000 Performance Advisor Software v5.4 User Guide (T1789-96328, April 2012)


of a component by viewing its data points collected at different collection rates in the same chart.
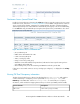
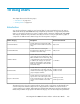
You can compare components across the XP and the P9000 disk arrays based on the following metric
categories. (Ensure that you select every element that you want to appear in your chart, because the
system charts only those elements that are specified):
NOTE:
Firmware version later than 50.09.33 snapshot PIDs are available for the XP12000 and the XP10000
Disk Arrays.
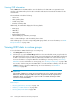
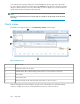
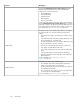
Charts screen
The Charts screen appears when you click Monitoring > Charts in the left pane.
Figure 26 Charts screen
.
Charts controls1
Component selection tree for charts2
Available Metrics Choose Metric Category list from where you select metrics for components3
Chart settings4
Zoom preview panel5
Chart window (blue border indicates that the chart window is selected or active)6
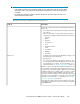
Click the black Up arrow positioned at the top right corner of the Data Source and Chart Settings
sections to collapse those sections. Click the black Down arrow to restore the sections.
Using charts258