
HP StorageWorks P9000 Performance Advisor Software v5.4 User Guide (T1789-96328, April 2012)


IMPORTANT:
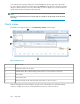
• In the Chart Work Area, plot performance graphs for any combination of the XP and the P9000
disk arrays, metrics, and components. Ensure that the components you select do not exceed 512
in number.
• By default, the performance graphs in the Chart Work Area are plotted only for the last 1 hour
of the management station's time.
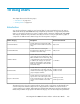
The Charts screen layout is divided into the following sections:
DescriptionSections
Includes the component selection tree that displays the following
main nodes:
• The XP and the P9000 disk arrays monitored by P9000 Perform-
ance Advisor.
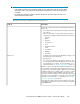
When you click an XP or a P9000 disk array, the respective
components are displayed under the following main categories:
• Front-end
• Cache
• Back-end
• Snapshot Pool
• Pools
• Replication Volumes
• LUSE
• Host Groups
• Ext-RG(s)
• Drive Types
In addition to the above listed, the MP Blades category is also
displayed for the P9000 disk arrays.
• Custom groups
The custom groups that you created appear. When you click
a custom group, all the LDEVs that belong to the custom group
are displayed for your selection. For more information on cre-
ating custom groups, see “Creating custom groups” on page 100.
Click the + sign for any of the above-mentioned categories to view
the associated component types and individual components. The
component types can further expand to display the corresponding
individual components. For example, when you click the + sign for
Front-end, it expands to display the Ports component type that
provides the list of individual ports on the selected XP or the P9000
disk array. For more information on selecting components from the
XP and the P9000 disk arrays, or custom groups, see “Selecting
components and metrics” on page 265.
The Configuration data collection for the XP and the P9000 disk
arrays must be complete for the component selection tree to appear
under Data Source.
Data Source
HP StorageWorks P9000 Performance Advisor Software User Guide 259