
HP StorageWorks P9000 Performance Advisor Software v5.4 User Guide (T1789-96328, April 2012)

DescriptionSections
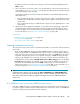
By default, each chart window is identified by the metric category
for which the performance metrics of components are plotted. The
Chart Work Area comprises of five chart windows, each
representing a specific metric category. The performance metrics
of components for the same metric category are plotted in a single
chart window and for different metric categories, the performance
metrics of components are plotted in separate chart windows. In
addition, the following are also displayed in each chart window:
• The total number of components for which the performance
graphs are plotted.
• The Legends check box that you can select based on whether
you want the legends list to appear in a particular chart win-
dow. This action overrides the Legends check box selection in
the Chart Settings section.
• The individual legends that you can click to show or hide the
corresponding performance graphs in a chart window.
• Status icons that indicate the current status of the chart window.
For example, if the data points cannot be plotted in the chart
window, a Warning status icon appears at the top left corner
of the chart window. Hover the pointing device over the status
icon to view the error or the current status that appears in a
tool tip. Click the status icon to refresh the chart window. The
chart window re-renders itself to plot the graphs again.
You can also maximize, minimize, or close the chart windows. For
more information, see “Viewing charts” on page 296.
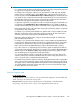
Individual chart windows
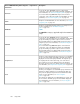
The Chart controls section displays common controls or buttons
used to perform specific tasks on charts, such as the following:
• Add a new chart window.
• Save charts as favorites and load the favorite charts.
• Save charts as PDF files.
• Print charts.
• Change the Chart Work Area layout.
• Update charts with the latest data points.
• Select all the chart windows in the Chart Work Area.
• Close charts in the Chart Work Area.
For more information, see “Using chart controls and
settings” on page 304.
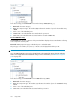
Chart controls
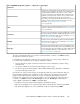
You can zoom on the performance data points for a specified
duration. You can use the Zoom preview panel that provides a
preview to the performance data displayed in the selected chart
window. You can also zoom on the data points directly in a chart
window.
For more information, see “Previewing charts” on page 316 and
“Zooming in on data points across performance
graphs” on page 317.
Zoom in and zoom out on data points
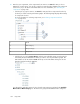
Tasks you can perform on the Charts screen
• “Plotting charts” on page 262
• “Viewing charts” on page 296
• “Using chart controls and settings” on page 304
HP StorageWorks P9000 Performance Advisor Software User Guide 261