
HP StorageWorks P9000 Performance Advisor Software v5.4 User Guide (T1789-96328, April 2012)
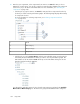
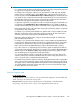
1. Click Monitoring > Charts in the left pane.
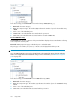
The Charts screen appears. By default, the Data Source section displays the following main nodes
in the component selection tree:
• The DKC or the model numbers of individual XP and P9000 disk arrays monitored by P9000
Performance Advisor. If user-friendly names are provided for the XP and the P9000 disk arrays,
they appear in brackets beside the DKC numbers.
• Custom Groups, lists the individual custom groups that you created.
For more information on custom groups, see “Creating custom groups” on page 100. For more
information on Charts screen layout, see “Charts screen” on page 258.
HP StorageWorks P9000 Performance Advisor Software User Guide 263