
HP StorageWorks P9000 Performance Advisor Software v5.4 User Guide (T1789-96328, April 2012)
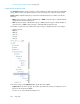

The applicable metrics are displayed in the Available Metrics Choose Metric Category list. Select the
metrics at the component type or the individual component levels, or both and view the related
performance graphs in the Chart Work Area. For a description of these metrics, see “Metric Category,
metrics, and descriptions” on page 439.
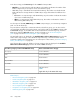
The following table provides the default set of metric categories that are displayed in the Available
Metrics Choose Metric Category list for the XP and the P9000 disk arrays.
Most used default metric categoryReplication Volumes category for XP and P9000 disk arrays
Frontend IO MetricsBusiness Copy Volumes
Frontend IO MetricsContinuous Access Volumes
Frontend IO Metrics
NOTE:
For Continuous Access Volumes, the following write metrics
are disabled:
• IO Metrics
• Total IO Writes — Frontend
• LDEV Random Writes — Frontend
• LDEV Sequential Writes — Frontend
• MB Metrics
• Total MB Writes – Frontend
• Random MB Writes – Frontend
• Sequential MB Writes — Frontend
• Utilization Metrics
• Average Write Response
• Maximum Write Response
LDEVs
Related Topics
• “Front-end navigation path” on page 269
• “Cache navigation path” on page 271
• “MP Blades navigation path” on page 273
• “Back-end navigation path” on page 275
• “Pools navigation path” on page 278
• “Snapshot Pool navigation path” on page 282
• “LUSE navigation path” on page 285
• “Host Groups navigation path” on page 287
• “Ext-RG(s) navigation path” on page 291
• “Drive types navigation path” on page 292
• “Custom groups navigation path” on page 293
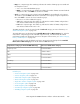
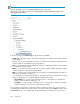
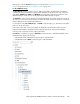
LUSE navigation path
The LUSE main category comprises of the individual LUSE masters that further expand to display the
list of associated LUSE components. Following is the component selection path:
HP StorageWorks P9000 Performance Advisor Software User Guide 285