
HP StorageWorks P9000 Performance Advisor Software v5.4 User Guide (T1789-96328, April 2012)


The serial numbers of the XP and the P9000 disk arrays to which the LDEVs belong are also
mentioned in brackets beside the LDEV IDs. You can create a custom group that has multiple LDEVs
from different XP and P9000 disk arrays. For more information on creating custom groups, see
“Creating custom groups” on page 100.
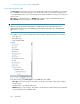
In the above image, CG_1_CG is one of the custom groups that is selected. The number (5) besides
the LDEVs component type indicates the total number of LDEVs grouped in CG_1_CG. The LDEVs
1:7A, 1:7C, and 1:7B display 30064 and the LDEV 9:67 displays 82502 beside their LDEV IDs. It
implies that these LDEVs are grouped from the XP disk arrays 30064 or 82502 under the CG_1_CG
custom group.
The metrics associated with the resources types and components for the selected custom group are
displayed in the Available Metrics Choose Metric Category list. Select the metrics at the component
type or the individual component levels, or both and view the related performance graphs in the Chart
Work Area. For a description of these metrics, see “Metric Category, metrics, and
descriptions” on page 439.
The following table provides the default set of metric categories that are displayed in the Available
Metrics Choose Metric Category list for the XP and the P9000 disk arrays.
Most used default metric categoryCustom Groups category for XP and P9000 disk arrays
Frontend IO MetricsLDEVs
Related Topics
• “Front-end navigation path” on page 269
• “Cache navigation path” on page 271
• “MP Blades navigation path” on page 273
• “Back-end navigation path” on page 275
• “Pools navigation path” on page 278
• “Snapshot Pool navigation path” on page 282
• “LUSE navigation path” on page 285
• “Replication Volumes navigation path” on page 284
• “Host Groups navigation path” on page 287
• “Ext-RG(s) navigation path” on page 291
• “Drive types navigation path” on page 292
Using charts294