
HP StorageWorks P9000 Performance Advisor Software v5.4 User Guide (T1789-96328, April 2012)

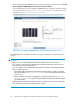


7. Enter your user name, password, and click Login.
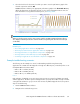
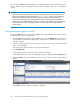
By default, the Frontend IO Metrics chart window appears in the Chart Work Area displaying
the performance graphs for the selected LDEVs.
You can also select additional metrics from the Available Metrics Choose Metric Category list.
For more information, see “Plotting charts” on page 262.
NOTE:
Once you login, the current session is valid for 24 hours.
In addition to the LDEVs, view the performance graphs of the other associated components, such as
the frontend and the backend components. For more information, see “Plotting charts” on page 262.
You can also use the other P9000 Performance Advisor screens to perform tasks, such as generating
reports and viewing events. For more information on the functionality and related procedures, see
the individual chapters in this guide.
Viewing performance graphs for RAID groups
To access P9000 Performance Advisor from P9000 Tiered Storage Manager and view the charts for
the RAID groups that belong to a storage domain:
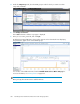
1. On HP P9000 Command View Advanced Edition Suite, click the Mobility tab to view the list of
the THP pools created for each array.
2. From the list of THP pool, select the THP pool for which you want to view the performance graphs
of the parity groups from which the THP pool is created.
3. Click the Parity Groups tab.
HP StorageWorks P9000 Performance Advisor Software User Guide 379