
HP StorageWorks P9000 Performance Advisor Software v5.4 User Guide (T1789-96328, April 2012)
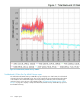
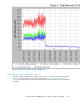
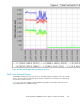
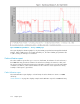
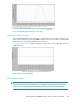
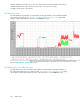

Figure 46 Total Backend I/O Rate First Top 8 LDEVs
.
Total Backend I/O Rate First Top 8 RAID Groups report
The Total Backend I/O Rate First Top 8 RAID Groups report displays in a chart format, the real backend
I/O rate for the busiest eight RAID groups. This can be compared to the potential maximum throughput
of the hardware. The maximum throughput varies depending on RAID level, disk mechanism type,
and other factors such as the size of the individual I/Os. “Total Backend I/O Rate First Top 8 Array
Groups” on page 413 displays a sample Total Backend I/O Rate First Top 8 RAID Groups report for
the XP1024 Disk Array.
Sample reports412