P9000Watch and P9000Sketch Reference Guide This guide is designed to help you understand and use the P9000Watch and P9000Sketch tools. It describes the functional capabilities and operational details of P9000Watch and P9000Sketch, and provides some examples of how to use the tool.
Legal and notice information © Copyright 2011 Hewlett-Packard Development Company, L.P. Confidential computer software. Valid license from HP required for possession, use or copying. Consistent with FAR 12.211 and 12.212, Commercial Computer Software, Computer Software Documentation, and Technical Data for Commercial Items are licensed to the U.S. Government under vendor’s standard commercial license. The information contained herein is subject to change without notice.
Contents 1 Introduction to P9000Watch ................................................................ 9 Overview ................................................................................................................................... 9 P9000Watch environment ......................................................................................................... 10 Software environment .........................................................................................................
Understanding performance metrics ............................................................................................ Array Performance Metrics ................................................................................................... Host Group performance metrics .......................................................................................... Port performance metrics .....................................................................................................
9 Support and other resources .............................................................. 79 Contacting HP .......................................................................................................................... Subscription service .................................................................................................................. Documentation feedback ...........................................................................................................
Figures 1 Working of P9000Watch ........................................................................................ 11 2 P9000 Performance Advisor logon screen .................................................................. 14 3 P9000 Performance Advisor home screen .................................................................. 14 4 Table of Contents screen .......................................................................................... 15 5 P9000Watch commands ........................
Tables 1 P9000Watch software environment ........................................................................... 10 2 P9000Watch hardware environment ......................................................................... 11 3 Navigation options and their functions ....................................................................... 20 4 Selection options .................................................................................................... 21 5 Miscellaneous options .................
1 Introduction to P9000Watch This chapter describes the features of P9000Watch (previously called XPWatch) and the environment required to run it. Overview P9000Watch is a command-line interface utility provided with HP StorageWorks P9000 Performance Advisor. It is designed for focused troubleshooting and can capture data as frequently as every 5 seconds. NOTE: The 5 seconds data capture frequency applies to XP or P9000 disk array configured with any number of LDEVs.
• Real-time performance data monitoring and collection for time intervals as low as 5 seconds • In the CLI mode (Command Line Interface), the output screen has the timestamp when the data is retrieved.
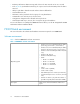
Hardware environment Table 2 lists the P9000Watch hardware environment. Table 2 P9000Watch hardware environment P9500 disk array and the XP24000, XP20000, XP12000, XP10000, SVS200, XP1024, XP128 disk arrays Array types Functional representation Figure 1 shows the functional representation of P9000Watch. Figure 1 Working of P9000Watch . The default mode in which the P9000Watch executes is the Interactive mode.
This scheme offers the following options: • Filter LDEVs by RAID Groups If you select this option, the RAID Groups menu appears. Select one or more RAID groups to view the LDEV menu. The LDEV menu lists all the LDEVs within the selected RAID groups. Select the required LDEV to collect and view the performance data. • Filter RAID Groups by LDEVs If you select this option, the LDEV menu appears. Select one or more LDEVs to view the RAID Group menu.
2 Installing P9000Watch This section describes installing and removing P9000Watch. It also describes the various components of P9000Watch. Prerequisites The following are the prerequisites to install P9000Watch: • The P9000 Performance Advisor host agent (v5.2 and above) must be installed on your host system. • The host must have a command device connected to the XP or P9000 disk arrays array to collect information from that array.
Figure 2 P9000 Performance Advisor logon screen . 3. Enter your User Name and Password and click Sign In. The P9000 Performance Advisor Home screen appears. Figure 3 shows the P9000 Performance Advisor Home screen. Figure 3 P9000 Performance Advisor home screen . 4. 14 On the Header menu, select Support. The screen displaying Table of Contents appears. Figure 4 shows the Table of Contents screen.
Figure 4 Table of Contents screen . 5. 6. 7. From the Tools menu, select the operating system for which you want to download the P9000Watch zip file. Extract the contents of the zip file to a location on your system. The XPWatch.exe and wagent.exe files are extracted. Double-click XPWatch.exe to run P9000Watch. You can also run P9000Watch using the command prompt. For example, c:\XPWatchTool\XPWatch.exe where, XPWatchTool is the folder containing the XPWatch.exe file.
Accessing P9000Watch P9000Watch can be accessed using the following two modes: • Interactive mode (default) • CLI mode (Non Interactive) NOTE: • Executing XPWatch.exe on a windows platform is equivalent to executing ./xpwatch on a non windows platform. By default, the P9000Watch will start in the Interactive mode. • P9000Watch commands are case-sensitive. Interactive mode Interactive mode is the default mode in which P9000Watch executes.
Components The software components of P9000Watch are: • XPWatch.exe — is an executable file used to launch the P9000Watch tool. • wagent.exe — is an executable file required to operate P9000Watch. • P9000Watch.log — stores information about the execution cycle of P9000Watch when the debug mode is enabled. • settings.ini — this file contains the default or customized menu settings. It is generated after the first use of P9000Watch. • .csv file — is the output file that saves performance data.
• -ARRAYPERF-.csv • CLI Mode • -LDEVPERF-.csv • -PORTPERF-.csv • -RGPERF-.csv • -CPUPERF-.csv • -DKCPERF-.
3 Working with P9000Watch menus and commands This section describes how to use the different modes, commands, menus, and interfaces of P9000Watch. Commands This section describes the menus and the options you choose in the Interactive mode, as well as the commands that you execute in the CLI mode. To see the Help options in the Interactive mode and CLI mode, the following command can be executed in the command prompt: For Windows platform, xpwatch.exe –h For a non-Windows platform, .
Figure 5 P9000Watch commands . Table 3 lists the Navigation options available in the P9000Watch interface and their functions. Table 3 Navigation options and their functions Command Option Function b Back To view the previous menu. c Continue To view the next menu. n Next page To view the next set of items, such as host groups, ports, RAID groups, and LDEVs. p Previous page To view set of items, such as host groups, Ports, RAID groups, and LDEVs displayed on the previous page.
Table 4 lists the Selection options available in the P9000Watch interface and their functions. Table 4 Selection options Command Option Function a Select All To select all items in a given menu. r Select None To clear all the selected items in a given menu. Table 5 lists the Miscellaneous options available in the P9000Watch interface and their functions. Table 5 Miscellaneous options Command Option Function s Settings To change the settings of P9000Watch.
—s To specify the XP or P9000 disk array serial number. To specify the host group which has to be monitored. You can provide multiple entries for host groups. —hg NOTE: There should be no space in between the comma separating the host groups. For example, –hg Node7,Node8 —f This is an optional parameter. It is used to specify the .csv filename. If this option is not specified, the archive file (.csv file) will not be created. —a This is an optional parameter.
—f This is an optional parameter. It is used to specify the .csv filename. If this option is not specified, the archive file (.csv file) will not be created. —a This is an optional parameter. It is used to specify the frequency of archiving data in the .csv file. If this option is not specified then the previously specified value shall be used. For more information, see Table 13. —hrs This parameter is used to specify the number of hours for which P9000Watch must be active.
NOTE: For the –f option, do not specify the file extension in the command prompt window. It is mandatory to specify either the —hrs or —min option. You can also specify both the options. Menus P9000Watch enables you to monitor and customize performance data of ports, RAID groups, LDEVs, and host groups through different menus.
Figure 6 Array menu . Table 7 lists the fields of the Array menu. Table 7 Array menu — fields Screen field Description Num Selection number Serial Serial number of the array Type Type indicates the array model. Supports P9000 disk array models such as, P9500 and XP disk array models such as XP 1024/48, XP10000, XP 12000, XP20000, and XP 24000. Host Groups The Host Groups screen lists the available host groups that are connected to the selected XP or P9000 disk array.
Figure 7 Available Host Groups: Sorted Alphabetically . Table 8 lists the fields in the Host Groups. Table 8 Host Groups — fields Screen field Description Num Selection number Nickname User-friendly names given to the hosts. Host Group Name Displays the host group name. Ports The port used by the XP or P9000 disk array to communicate with the host. Viewing Host Groups To view the host groups connected to an array, perform the following steps: 1. Start P9000Watch. The Array menu appears. 2.
Selecting Host Groups Select the host whose performance data you want to monitor. To select a host group, enter the number corresponding to it. For example, to select HWP10 and Kalam host groups (see figure Available Host Groups), perform the following steps: 1. Enter 111 and press the Enter key. The HWP10 host group is selected as shown in the following figure. NOTE: The selected host group is highlighted in green. Figure 8 shows one host group selected from the list of available host groups.
Figure 9 Available Host Groups: Two Host Groups selected . Clearing Host Groups To clear a selected host group, enter its corresponding number. For example, to clear the Kalam host group, enter 118 and press the Enter key. The Kalam host group is cleared. Figure 10 shows the screen that appears after clearing the Kalam host group.
Figure 10 Clearing a Host Group . NOTE: The cleared host groups are not highlighted in green. Nickname menu The Nickname menu enables you to provide a nickname to the host to identify the host easily. For example, you can identify a host that is known by FS-Pyramus as “PA_Watch_HA”. NOTE: • The Nickname menu can be accessed only from the host groups screen. • The nicknames must be provided when the P9000Watch is launched for the first time after installation.
Figure 11 Nickname menu . Assigning nicknames This section describes how to assign nicknames to a host group. For example, to assign a nickname to the FS-Pyramus host group, perform the following steps: 1. 2. 30 Navigate to the Available Host Groups screen. Type x. The following screen appears.
Figure 12 Nickname menu: Selecting a host group to assign nickname . 3. 4. Type 97 and press the Enter key. Enter the new nickname. For example, PA_Watch_HA. Figure 13 Nickname menu: Entering new nickname . 5. Press the Enter key. The following screen, showing nickname as PA_Watch_HA, appears.
Figure 14 Nickname menu: Displaying new nickname . Renaming nicknames To rename a nickname, perform the following steps: 1. 2. Select the host group whose nickname you want to rename and press the Enter key. Enter the new nickname and press the Enter key. Deleting nicknames To delete a nickname, select the host group whose nickname you want to remove and press the Enter key twice. For example, to remove the PA_Watch_HA nickname, perform the following steps: 1.
2. Press the Enter key. (Do not enter any new nickname) The Host Nickname is removed and the following screen appears. Port menu The Port menu lists all the ports that are connected to the selected host groups. This menu is used to select the port whose performance needs to be monitored or captured. Figure 15 shows the Port menu.
Figure 15 Port menu . Table 9 describes the fields that appear in the Port menu. Table 9 Port menu — screen fields Screen field Description Num Selection number Port Port number Slot Slot number Type Type of port (SCSI, Fibre, ESCON, iSCSI, ENAS, FCoE) Topo Connection type (N for point-point, NL for FC-AL) FLOGI Fabric login (Y/N) Mode Operating mode of the port (Target, MCU Initiator, RCU Target, e-LUN initiator) Secu Security switch (On/Off) Storage Logical Partition (SLPR) number.
Screen field Description Dg# Count of RAID groups mapped to the port LDEV# Count of LDEVs mapped to the port Lh# Count of unique LDEVs mapped to the port Viewing Port menu To view the ports connected to a host, perform the following steps: 1. 2. 3. 4. Start P9000Watch. The Array menu appears. Select the array whose performance you want to monitor and press the Enter key. The Available Host Groups screen displaying the list of host groups connected to the array appears.
2. 3. 4. 5. Select the array whose performance you want to monitor and press the Enter key. The Available Host Groups screen displaying the list of host groups connected to the array appears. Select the required host and enter the c command. The Port menu showing all ports connected to the hosts appears. Select the required port and enter the c command. The Pick LDEVs/RAID Groups Selection Scheme screen appears.
Screen field Description DKA# Count of DKAs associated with LDEVs mapped to port Pg The Pg column displays the entire list of concatenated RAID groups NOTE: • If the RAID groups are not configured, the RAID Group menu will display blank screen fields. • For non-concatenated RAID groups, the Rg and Pg columns display the same data.
Screen field Description LDEV CU: LDEV number RG RAID group Emulation Emulation type SLPR number NOTE: Slpr Slpr does not exist in the P9000 disk arrays. So, the Slpr field displays N/A for the P9000 disk array in the output screen of the LDEV menu.
Figure 19 Settings menu . Menu settings Menu settings enable you to modify the settings of the interface. For example, the Menu settings allow you to modify the appearance of the menus. Table 12 describes the Menu settings. Table 12 Menu settings Settings Functions Default Value Valid Range Menu Height Changes the number of items that appear in the menu. 20 lines 1-50 lines Disabled NA Deletes the cache files NA • If this mode is enabled, the program creates a file P9000Watch.
Table 13 describes the Performance data collection settings. Table 13 Performance data collection settings Settings Functions Default value Valid range 24 hours 1-168 hours 24 hours, 0 minutes 1-167 hours, 1–60 minutes Ports: 10 LDEVs: 10 RAID groups: 10 host groups: 10 Ports: 1-50 LDEVs: 1-50 RAID groups: 1-50 host groups: 1-50 10 seconds 5 - 300 seconds Splits the data according to the time intervals (in hours) and stores them in different .csv files.
Settings Functions Default value Valid range 10 seconds 5 - 300 seconds Enables you to specify the frequency at which the performance data of a disk array should be archived in the .csv file. NOTE: Archival Frequency By default, the archival frequency is 10 seconds in the Interactive and CLI modes, where the data is archived every 10 seconds. You can specify a minimum of 5 seconds or a maximum of 300 seconds as the archival frequency.
Working with P9000Watch menus and commands
4 Viewing performance metrics in P9000Watch This section describes how to collect the performance data of the XP and the P9000 disk arrays and view the performance metrics using P9000Watch. Collecting performance metrics This section describes how to collect performance data of the XP and the P9000 disk arrays using P9000Watch. The Array menu appears after you invoke P9000Watch. Follow this procedure to collect the performance data of the XP and the P9000 disk arrays: 1. 2. 3. 4. 5. 6. 7.
a. b. c. d. e. Enter 2 to select this option. The LDEVs within the host groups are displayed. Select the required LDEVs. Enter the c command. The RAID groups within the LDEVs are displayed. Select the required RAID groups. Enter the c command. The following message appears: Would you like to archive the performance data collected? (Y/N) f. Enter Y to save the performance data in .CSV format. The Output screen appears.
NOTE: If you enter N, the performance data is not saved in the .CSV format. However, you can view the performance data on the output screen. Understanding performance metrics The Output screen and the seven output files .csv files that are generated, one file for each component, contain performance metrics pertaining to host groups, ports, LDEVs, RAID groups, CPU, DKC, and Array utilization of the selected XP or P9000 disk arrays.
Figure 20 Output screen for a XP disk array . Figure 21 shows the Output screen for a P9000 disk array.
Figure 21 Output screen for a P9000 disk array . NOTE: Adjust your screen resolution (maximum resolution recommended) and font size accordingly for better readability. The output files in the Interactive mode and CLI mode are saved in the TLVIz and TABS format respectively. The output files in the Interactive mode can be imported into P9000Sketch. However, the output files in the CLI mode cannot be imported into P9000Sketch.
Array Performance Metrics Table 14 describes the Array performance metrics.
Port performance metrics Table 16 describes the Port performance metrics.
Performance metrics Unit Description ms ms Average I/O Response time r_ms ms Average Read Response time w_ms ms Average Write Response time ms^ ms Maximum of (Maximum Read Response time and Maximum Write Response time) r_ms^ ms Maximum Read Response time w_ms^ ms Maximum Write Response time FeD number Front-end I/O Density [IOPS/GB] Be/Fe number Back-end/Front-end I/O ratio LD% % Average LDEV I/O utilization Be number Back-end I/O RAID group performance metrics Table 18 desc
Performance metrics Unit Description r_ms^ ms Maximum Read Response time w_ms^ ms Maximum Write Response time FeD number Front-end I/O Density [IOPS/GB] Be/Fe number Back-end / Front-end I/O ratio RG% % Average RAID group I/O utilization Be number Back-end I/O CPU performance metrics Table 19 describes the CPU performance metrics. Table 19 CPU performance metrics Performance metrics Unit Description Ser number Serial number of the array CH slot number.
Performance metrics MP0 Unit Description For an XP disk array, MP0 is the CHA PCB Busy Time for CPU 0 (if installed). number MP1 For a P9000 disk array, MP0 is the MP busy time for CPU 0 (if installed). For an XP disk array, MP1 is the CHA PCB Busy Time for CPU 1 (if installed). number MP2 For a P9000 disk array, MP1 is the MP busy time for CPU 1 (if installed). For an XP disk array, MP2 is the CHA PCB Busy Time for CPU 2 (if installed).
Performance metrics Unit Description CmDka% % DKA to cache memory Xbar utilization CmUs[MB] number Cache usage [MB] (CLPR0) CmWr[MB] number Write cache usage [MB] (CLPR0) CmSf[MB] number Side File usage [MB] (CLPR0) CmRdH number Cache random read hits (CLPR0) CmUs% % Cache utilization [%] (CLPR0) CmWr[%] % Write cache utilization [%] (CLPR0), max=70% P9000Watch and P9000Sketch Reference Guide 53
Viewing performance metrics in P9000Watch
5 Introduction to P9000Sketch This section gives an overview of P9000Sketch. Overview P9000Sketch is a tool provided by HP to enable you to view the performance metrics of different components of an XP or a P9000 disk array in a graphical format. The performance metrics obtained on monitoring the selected XP or the P9000 disk array’s host groups, ports, LDEVs, RAID, CPU, and DKC Groups including the array level metrics for a specified duration are stored in seven comma-separated files (.
Introduction to P9000Sketch
6 Installing P9000Sketch This chapter lists the supported environment for P9000Sketch (previously called XPSketch) and describes the installation for P9000Sketch.
The P9000 Performance Advisor logon screen appears. Figure 22 shows the P9000 Performance Advisor Logon screen. Figure 22 P9000 Performance Advisor Logon screen . 3. 4. Enter your user name and password.
Figure 24 Table of Contents screen . 6. 7. 8. On the P9000 Performance Advisor Support screen, under Tools, click the P9000Sketch (Windows 32-bit) link to download the XPSketch.zip file to a P9000 Performance Advisor server, your local system, or a remote system. After the download, the P9000Sketch tool can work independently of P9000 Performance Advisor. Extract the contents of the zip file to a location of your choice on the designated system. Double-click Run.bat to execute P9000Sketch.
NOTE: When you double-click Run.bat, sometimes P9000Sketch might not start immediately, or might appear and disappear immediately. This is because the system searches for the JRE files that are required to start P9000Sketch. By default, the JRE path is automatically set. However, to verify the path, complete the following steps: a. On your system, right-click My Computer, and select Properties from the pop-up menu that appears. b. On the System Properties window, click the Advanced tab. c.
7 Viewing performance metrics in P9000Sketch This section describes loading the .csv files, setting the Java heap size value, and viewing performance metrics in P9000Sketch. Loading the Comma separated file The performance metrics obtained on monitoring the selected XP or the P9000 disk array’s host groups, ports, LDEVs, RAID, CPU, and DKC groups including the array level metrics for a specified duration are stored in seven .csv files, one file for each component. The .
Setting the Java heap size value At a time, the number of metrics that can be loaded in P9000Sketch depends on the minimum and maximum Java heap size values specified for P9000Sketch. The default minimum and maximum Java heap size values are 70 MB and 128 MB respectively. You can increase the maximum Java heap size value by modifying a property value in run.bat. By default, when you open run.
Figure 26 Performance report generated using P9000Sketch . You can select multiple metrics at a time. Accordingly, multiple graphs are plotted in the Graph Area, as shown in figure below. This is especially useful when you want to analyze the performance metrics of components across different time intervals. Different color codes are used to differentiate the various metrics when they are plotted in the Graph Area.
Figure 27 Multiple graphs plotted for multiple metric selection . You can also view the Metrics Available, Samples Available, and Samples Displayed data for the CSV file that is currently loaded in P9000Sketch. Point to a location on the Metrics label, as shown in Figure 28. Figure 28 shows the available metrics and samples displayed on the screen. Figure 28 Metric available, samples available, and samples displayed .
Understanding performance metrics in P9000Sketch This section describes the Array, Host Group, Port, LDEV, RAID, CPU, and DKC Group performance metrics.
Performance Metrics Description MinKB Minimal throughput of the last 60 seconds MaxKB Maximum throughput of the last 60 seconds AvgKB Average throughput of the last 60 seconds Table 24 describes the LDEV performance metrics.
Performance Metrics Description IO response time [ms] Average I/O Response Time Back-end to Front-end IO ratio [%] Back-end / Front-end I/O ratio Cache lines staged/destaged [1/s] Back-end I/O r_ms [ms] Average Read Response time w_ms [ms] Average Write Response time ms^ [ms] Maximum of (Maximum Read Response time and Maximum Write Response time) r_ms^ [ms] Maximum Read Response time w_ms^ [ms] Maximum Write Response time Table 26 describes the CPU performance metrics.
Performance Metrics Description DKA to cache memory utilization [%] DKA to cache memory Xbar utilization [%] Cache usage [MB] Cache usage for CLPR0 [MB] Write cache usage [MB] Write cache usage for CLPR0 [MB] Side File usage [MB] Side File usage for CLPR0 [MB] Cache random read hits Cache random read hits for CLPR0 Cache utilization [%] Cache utilization for CLPR0 Write cache utilization [%] Write cache utilization [%] for CLPR0, max=70% 68 Viewing performance metrics in P9000Sketch
8 Working with charts in P9000Sketch This section describes viewing, modifying, saving, and printing charts in P9000Sketch. It also describes restoring the auto range settings on the chart. Viewing charts You can zoom in or zoom out on a chart on either the Domain Axis, Range Axis, or both. To zoom in, on the Options menu, point to Zoom In and select one of the following options: • Both— Select this option if you want to zoom in on both Domain Axis and the Range Axis.
• Clear the Show Title checkbox if you do not want the chart title to be displayed. • Under the Plot tab: • Go to Appearance tab to change the appearance and orientation of the chart. • Go to Domain Axis or Range Axis tabs to: • Change the other general settings for Domain Axis or Range Axis • Clear the Show Tick Labels checkbox if you do not want the labels to be displayed on the Domain Axis or the Range Axis.
A P9000Watch use case scenarios Scenario 1: Port I/O spike Business case Periodic port I/O spikes are observed in P9000 Performance Advisor. Objective Locate the offending host group/application. Resolution P9000Watch can be used to find the hot spot by collecting the performance data for very short intervals, such as, 10 seconds. Perform the following steps to find the hot spot: 1. 2. Select the affected port (You can find the affected port using P9000 Performance Advisor).
Objective Confirm the observation using P9000Watch. Resolution In this case, P9000Watch can help you to isolate the XP or the P9000 disk array’s performance from the application’s performance. Using P9000Watch, perform the following steps: 1. 2. 3. 4. Select the host group or server where the application is running. All ports attached to the host groups are displayed. Select all ports attached to the host groups. Select all LDEVs and RAID groups attached to the ports.
B Understanding write ratio in P9000Watch The following screen shows the performance of the entire RAID group 01-04 being collected with the performance of LDEVs 01:6c, 01:6d, 02:a3, 02:a4, and 02:a5. The LDEVs in RAID group 01-04 are exposed only through port 1A. There are no I/O activities or LDEVs reported on this port because there is no I/O activity in port 1A and these LDEVs are not visible through any other port.
NOTE: We can conclude all the front-end I/Os on the RAID group are writes because the r_H% (cache read hit %) is 0; that is, there are no front-end reads.
C Relationship between LDEV I/O response time and Write ratio We cannot establish a relationship between the LDEV I/O response time and Write ratio because: • LDEV I/O response time is dependent on both front-end reads and front-end writes. • Write ratio provides only the write percentage in the I/Os. NOTE: The LDEV I/O response time shown by P9000Watch is the average I/O response time measured in milliseconds (that is, both reads and writes together are responsible for variations in this value).
Relationship between LDEV I/O response time and Write ratio
D Comparing LDEV response time metrics in P9000 Performance Advisor and P9000Watch Maximum values of LDEV response time in P9000 Performance Advisor and P9000Watch The maximum values of LDEV response time in P9000 Performance Advisor cannot be compared with the response time values in P9000Watch because P9000 Performance Advisor displays the I/O response time as separate metrics for read and write, respectively.
Comparing LDEV response time metrics in P9000 Performance Advisor and P9000Watch
9 Support and other resources Contacting HP For worldwide technical support information, see the HP support website at: http://www.hp.
http://www.hp.com/support/storagedocsurvey Thank you for your time and your investment in HP storage products.
Convention Element • Keys that are pressed Bold text Italic text • Text typed into a GUI element, such as a box • GUI elements that are clicked or selected, such as menu and list items, buttons, tabs, and check boxes Text emphasis • File and directory names Monospace text • System output • Code • Commands, their arguments, and argument values Monospace, italic text Monospace, bold text • Code variables • Command variables Emphasized monospace text WARNING! Indicates that failure to follow direction
Support and other resources
Glossary Array Control Processor (ACP) ACP is used in the XP disk arrays prior to the XP24000 Disk Array. With the introduction of the XP24000 Disk Array, the DKA has replaced ACP. The DKA is also applicable for the P9000 disk arrays. ACP handles the transfer of data between the cache and the physical drives held in the DKUs. The ACPs work in pairs, providing a total of eight SCSI buses. Each SCSI bus associated with one ACP is paired with a SCSI bus on the other ACP pair element.
CHIP Channel host interface processor. Synonymous with the term CHA. Command Line User Interface (CLUI) In addition to its GUI, P9000 Performance Advisor also provides a command-line utility called the CLUI to monitor real-time performance of the XP and the P9000 disk arrays. The CLUI allows you to monitor performance, set alarms, and configure host information using commands and scripts. You can execute commands in the CLUI and view the same data that is displayed on the GUI.
the DSF allows the software to interact with a device driver using the standard input or the output system calls. emulation mode The LDEVs associated with each RAID group are assigned an emulation mode that makes them operate like OPEN system disk drives. The emulation mode determines the size of an LDEV. OPEN-3: 2.46 GB OPEN-8: 7.38 GB OPEN-9: 7.42 GB OPEN-E: 13.
MP blades The MP blades are the microprocessor blades in the P9000 disk arrays. Each MP blade has four MPs residing on it. The MPs that reside on the CHAs and the DKAs in the XP disk arrays form part of the MP blades in the P9000 disk arrays. Multiprocessor (MP) In an XP disk array, the MPs are installed on the CHAs and the DKAs. The MPs on a CHA are addressed as CHPs and the MPs on a DKA are addressed as DKPs. In a P9000 disk array, the MPs do not reside on the CHAs and DKAs.
Storage Logical Partition (SLPR) NOTE: The SLPR component is applicable only for the XP disk arrays. It does not exist in the P9000 disk arrays. As a result, the SLPR-related data is not displayed in P9000 Performance Advisor for the P9000 disk arrays. The SLPR is a partition of the RAID500 to which the host ports (1 or more) and the CLPRs (1 or more) are assigned. The SLPR0 will always exist (cannot be deleted). Sometimes, the SLPR acronym includes an additional word.
Glossary
Index A Archival Frequency, 41 Array menu, 24 Average read response time, 77 write percentage, 73 write response time, 77 C Collection Update Interval, 40 conventions document, 80 text symbols, 81 L LDEV average response time in Performance Advisor and P9000Watch, 77 Filter LDEVs by RAID groups, 12, 43 LDEV I/O response time and write ratio, 75 manually add LDEV without filtering, 12 manually add LDEVs without filtering, 44 maximum response time in Performance Advisor and P9000Watch, 77 menu, 37 performan
P9000Watch commands, 19 components, 17 installing, 13 menus, 24 performance metrics, 43 uninstalling, 16 P9000Watch files CSV file, 17 P9000Watch.log, 17 settings.ini, 17 wagent.exe, 17 XPWatch.