
P9000Watch and P9000Sketch Reference guide for HP StorageWorks P9000 Performance Advisor v5.3 (T1789-96325, August 2011)

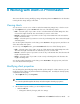

Setting the Java heap size value
At a time, the number of metrics that can be loaded in P9000Sketch depends on the minimum and
maximum Java heap size values specified for P9000Sketch. The default minimum and maximum Java
heap size values are 70 MB and 128 MB respectively.
You can increase the maximum Java heap size value by modifying a property value in run.bat. By
default, when you open run.bat in the Command Prompt window, the following data is displayed:
java -Xms70m —Xmx128m P9000Sketch
where: -Xms70m refers to the minimum Java heap size value (the minimum system memory that is
required for P9000Sketch to load a .csv file in P9000Sketch), and –Xmx128m refers to the maximum
Java heap size value. The maximum Java heap size value refers to the maximum system memory that
can be set based on the memory available in your system and also the metrics collected in the .csv
file.
The Java heap size value is directly proportional to the metrics collected in a .csv file, and also the
combination of metrics that you want to view in a graphical format. More the metrics collected, more
is the memory required (Java heap size value) to load the .csv file. More the metrics selected for
viewing, more is the memory required for plotting the numerous data points from the selected metrics.
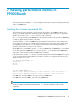
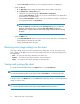
Figure 25 shows the error message that is displayed when the metric count in the .csv file is higher
compared to the Java heap size value specified in run.bat.
Figure 25 Error message
.
NOTE:
• Ensure that the size of the CSV file to be loaded is not more than the configured heap size.
• The maximum Java heap size that can be configured depends on the operating system specification.
For more information, see the Windows operating system documentation.
Viewing performance metrics in P9000Sketch
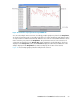
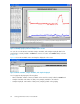
After the .csv file is loaded, the performance metrics of different components collected for specified
durations are displayed in the Metrics Pane. By default, the first set of data points collected for the
first metric that appears in the Metrics Pane is automatically plotted in the Graph Area. If the data
collection is more for a metric in a specified time interval and all the data points are not displayed
in the same graph, click the > button to view the plotting of the next set of data points. To view the
first set of data points, click the < button.
Figure 26 shows a performance report generated using P9000Sketch.
Viewing performance metrics in P9000Sketch62