
P9000Watch and P9000Sketch Reference guide for HP StorageWorks P9000 Performance Advisor v5.3 (T1789-96325, August 2011)


Understanding performance metrics in P9000Sketch
This section describes the Array, Host Group, Port, LDEV, RAID, CPU, and DKC Group performance
metrics.
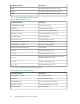
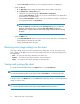
Table 21 Array Group performance metrics
DescriptionUnitPerformance metrics
The array for which the perform-
ance is displayed
NumberArray
Minimal I/O rate of the last 60
seconds
IO/sMinIO
Maximum I/O rate of the last 60
seconds
IO/sMaxIO
Average I/O rate of the last 60
seconds
IO/sAvgIO
Minimal throughput of the last 60
seconds
MB/sMinMB
Maximum throughput of the last 60
seconds
MB/sMaxMB
Average throughput of the last 60
seconds
MB/sAvgMB
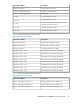
Table 23 describes the Host Group performance metrics.
Table 22 Host Group performance metrics
DescriptionPerformance Metrics
Average Front-end I/Os over the collection update interval, which is
set to a default value of 10 seconds.
IOPs (TotalRd + TotalWr)
Average Throughput over the collection update interval, which is set
to a default value of 10 seconds.
Throughput [MB/s]
Table 23 describes the Port performance metrics.
Table 23 Port performance metrics
DescriptionPerformance Metrics
Average I/O rate of the last measurement intervalCurIO
Minimal I/O rate of the last 60 secondsMinIO
Maximum I/O rate of the last 60 secondsMaxIO
Average I/O rate of the last 60 secondsAvgIO
Calculate average I/O size (=avgKB / avgI/O)KB/IO
Average throughput of the last measurement intervalCurKB
P9000Watch and P9000Sketch Reference Guide 65