
P9000Watch and P9000Sketch Reference guide for HP StorageWorks P9000 Performance Advisor v5.3 (T1789-96325, August 2011)


DescriptionPerformance Metrics
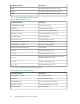
Minimal throughput of the last 60 secondsMinKB
Maximum throughput of the last 60 secondsMaxKB
Average throughput of the last 60 secondsAvgKB
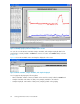
Table 24 describes the LDEV performance metrics.
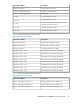
Table 24 LDEV performance metrics
DescriptionPerformance Metrics
Average Front-end I/OsAvgIO (TotalRd + TotalWr)
Average Write percentageWrite Ratio %
Average Sequential I/O percentageSequential IO ratio %
Average Read Cache Hit percentageRead hits % for LDEV
Average ThroughputThroughput [KB/s]
Average I/O Response TimeIO response time [ms]
Back-end / Front-end I/O ratioBack-end to Front-end IO ratio [%]
Average LDEV I/O utilizationLDEV Utilization % for LDEV
Back-end I/OCache lines staged/destaged [1/s]
Average Read Response time
r_ms [ms]
Average Write Response time
w_ms [ms]
Maximum of (Maximum Read Response time and
Maximum Write Response time)
ms^ [ms]
Maximum Read Response time
r_ms^ [ms]
Maximum Write Response time
w_ms^ [ms]
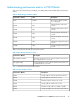
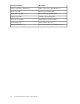
Table 25 describes the RAID group performance metrics.
Table 25 RAID group performance metrics
DescriptionPerformance Metrics
Average Front-end I/OsAvgIO (TotalRd + TotalWr)
Average Write percentageWrite Ratio %
Average Sequential I/O percentageSequential IO ratio %
Average Read Cache Hit percentageRead hits % for LDEV
Average ThroughputThroughput [KB/s]
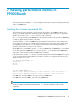
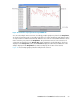
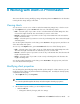
Viewing performance metrics in P9000Sketch66