
P9000Watch and P9000Sketch Reference guide for HP StorageWorks P9000 Performance Advisor v5.3 (T1789-96325, August 2011)

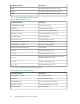

DescriptionPerformance Metrics
Average I/O Response TimeIO response time [ms]
Back-end / Front-end I/O ratioBack-end to Front-end IO ratio [%]
Back-end I/OCache lines staged/destaged [1/s]
Average Read Response time
r_ms [ms]
Average Write Response time
w_ms [ms]
Maximum of (Maximum Read Response time and
Maximum Write Response time)
ms^ [ms]
Maximum Read Response time
r_ms^ [ms]
Maximum Write Response time
w_ms^ [ms]
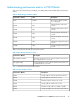
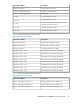
Table 26 describes the CPU performance metrics.
Table 26 CPU performance metrics
DescriptionPerformance Metrics
Minimum CPU utilization on PCB[%]Minimum Utilization[%]
Maximum CPU utilization on PCB[%]Maximum Utilization[%]
Average CPU utilization on PCB[%]Average Utilization[%]
CHA PCB Busy Time for CPU 0(if installed)Utilization for MP 0 0[1/s]
CHA PCB Busy Time for CPU 1(if installed)Utilization for MP 1 0[1/s]
CHA PCB Busy Time for CPU 2(if installed)Utilization for MP 2 0[1/s]
CHA PCB Busy Time for CPU 3(if installed)Utilization for MP 3 0[1/s]
CHA PCB Busy Time for CPU 4(if installed)Utilization for MP 4 0[1/s]
CHA PCB Busy Time for CPU 5(if installed)Utilization for MP 5 0[1/s]
CHA PCB Busy Time for CPU 6(if installed)Utilization for MP 6 0[1/s]
CHA PCB Busy Time for CPU 7(if installed)Utilization for MP 7 0[1/s]
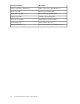
Table 27 describes the DKC performance metrics.
Table 27 DKC performance metrics
DescriptionPerformance Metrics
CHA to shared memory bus utilization [%]CHA to shared memory utilization [%]
DKA to shared memory bus utilization [%]DKA to shared memory utilization [%]
CHA to cache memory Xbar utilization [%]CHA to cache memory utilization [%]
P9000Watch and P9000Sketch Reference Guide 67