HP Integrated Archive Platform Performance Graphs and Counters Whitepaper
Manuals
Brands
HP Manuals
Software
HP StorageWorks Reference Information Storage System V1.5 Upgrade Kit
1
2
3
4
5
6
7
8
9
10
10
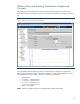
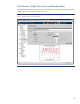
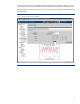
Figure 8 shows the percen
tage of Idle CPU utilization for the PCC server in
5 minute
intervals for the
last 7 Days. Selecting a sampling rate of 5 minutes cr
eates the graph shown in Figur
e 8.
Figure 8. Performance Graph 5 Minute Sample
Rate
1
...
...
8
9
10
11
12
...
...
16