
HP Integrated Archive Platform Performance Graphs and Counters Whitepaper


12
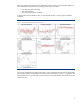
Errors can occur when attempting to display a performance graph over an extended period of time
while using a short time interval for the sampling rate. In Figure 10, we have attempted to display the
last 14 days of Idle CPU utilization using a high sampling rate of 5 minutes. As you can see, the
system was unable to create a graph for this time period using this sampling rate.
Figure 10. Performance Graph Sample Rate Error
The values selected result in a very large number of data points – too many to graph. Selecting an
hourly sample rate (or greater) for this graph would have resulted in the successful display of the
performance data.