
HP Integrated Archive Platform Performance Graphs and Counters Whitepaper

6
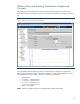
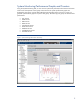
The following system level counters are collecting performance data from each server in a host group:
• Idle CPU – Percentage of time the processor is not active. For example, if the CPU counter
averages 70% idle, then we can conclude the CPU was busy processing tasks 30% of the
time.
• Free Memory – The Free Memory counter is a percentage of total system memory utilized
• JVM Heap Total – Amount of memory reported in bytes JVM has allocated for Java
Objects
• JVM Heap Used – Amount of memory reported in bytes JVM is using to store active Java
Objects
• JVM Virtual Memory Used – Amount of virtual memory reported in bytes the JVM
processes are using
• IO – Percentage of total disk utilization
• Active Thread Count – Number of Java threads that JBoss is running
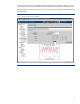
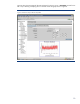
Figure 4. System Monitoring Performance Counters
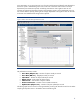
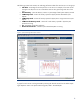
A graph for each counter can be generated by selecting the desired counter from the Select Graph
Type drop-down menu in the System Monitoring (CPU, MEM – Thresholds) tab.