HP Integrated Archive Platform Performance Graphs and Counters Whitepaper
Manuals
Brands
HP Manuals
Software
HP StorageWorks Reference Information Storage System V1.5 Upgrade Kit
1
2
3
4
5
6
7
8
9
10
8
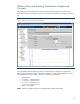
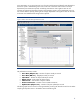
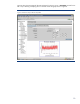
Performance Graph Time Lines and Sample Rates
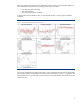
Using the
Select Time Frame
drop-down menu, an administrator ca
n select a performance graph that
ranges from the last 15 Minu
tes to the Previous Year.
Figure 6. Performance Graph Time Range Selection
1
...
...
6
7
8
9
10
...
...
16