
HP StorageWorks Reference Information Storage System V1.0 Administrator Guide (May 2004)

LO
Chapter 2:
Persist Control Center
PCC Views, Detailed Descriptions
2-22 HP StorageWorks Reference Information Storage System Administrator Guide, April 2004
unacknowledged (
unhandled
). You can investigate these problems further
using other views. This view also lets you enable or disable individual
monitoring features.
The following table describes the
Tactical Overview
view features.
Table 2-18: Tactical Overview
View Features
Feature Description
Monitoring
Performance
The current performance of monitoring processes:
• Check Execution Time – Minimum, maximum and average times
to execute a monitoring check
• Check Latency – Minimum, maximum and average durations
between the time a monitoring check was scheduled and the
time it was executed
• # Active Checks – How many services are monitored
• # Passive Checks – Currently
not used
(all checks are active)
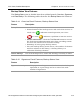
Network Health Color-coded indication of the average health of all hosts and
services. Green indicates normal operation; red indicates one or
more components have stopped or failed; yellow indicates
potential problems (warning). See
Host and Service Status
Value Definitions
, page 1-6, for more information.
Hosts Number of hosts with each host status value
Click the number of hosts with a given status value, for example
2DOWN, to display a filtered Service Status Details view for all
services running on those hosts – see
Service Detail
, page 2-26.
The hosts with problem status values are divided into those
with acknowledged problems and the rest (unhandled). Click the
appropriate link to show details of those hosts:
•
<#>
Unhandled Problems
•
<#>
Acknowledged
Either link displays a filtered Service Status Details view for the
appropriate hosts – see
Service Detail
, page 2-26.
See
Example: Acknowledging a Problem
, page 2-115, for
information on acknowledging a problem.