
HP StorageWorks Reference Information Storage System V1.0 Administrator Guide (May 2004)

PCC Views, Detailed Descriptions Chapter 2:
Persist Control Center
HP StorageWorks Reference Information Storage System Administrator Guide, April 2004 2-61
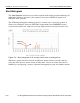
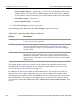
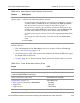
value. For example, the histogram below shows only the recovery (
OK
) events
for the same time period. The
OK
event line from 11:15 to 13:15 was hidden
by
CRITICAL
and
WARNING
event lines in the above histogram.
Figure 2-3: Alert histogram of recovery service events over one-day period
How To Create an Alert Histogram Report
1. Choose the report type:
Host
or
Service
.
2. Choose the host or service to report on.
3. Choose the report options:
– Report Period
– Choose a predefined period (
Last 24 Hours
,
Toda y
,
Yesterday
,
This Week
,
Last 7 Days
,
Last Week
,
This Month
,
Last Month
,
This
Year
,
Last Year
); or choose
* CUSTOM REPORT PERIOD *
and specify the
custom report start and end dates.
– Statistics Breakdown
– Choose the time scale to use for the
Report Period
:
Month
,
Day of the Month
,
Day of the Week
, or
Hour of the Day
.
– Events To Graph
– Choose the type of host or service events to report on:
events indicating change to a specific status value, all problem status
values, or all events.
– State Types To Graph
– Choose which status conditions to graph:
HARD
,
SOFT
, or both. See
Hard and Soft Status Condition Definitions
,
page 1-7.
OK Event Line Was Hidden
Behind Warning Event Line