
HP StorageWorks Reference Information Storage System V1.4 Administrator Guide (T3559-96027, March 2006)


2. In the Command Options section, click Commit.
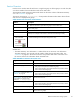
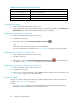
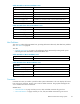
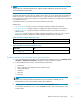
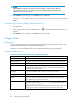
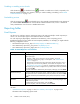
Table 54 Process commands, N agios Info view
Command link
Description
Shutdown the Nagios
process
Shuts down Nagios process.
Note: After Nagios is shut d own, it cannot be restarted via the web interface.
Restart the Nag
ios
process
Restarts Nagio
s process. This is equivalent to sending the process a HUP signal.
All information is flushed from memory, configuration files are reread, and Nagios
starts monito
ring with new c onfiguration information.
Enable automatic email
notifications for important
system events
Enables host and service notifications on program-wide basis.
Stop executing service
checks
Temporarily stops execution of service checks, and prevents notifications from
being sent (for a ll services and hosts). Service checks are not executed again until
you i ssue a command to resume service check execution.
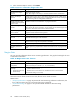
Stop accept
ing passive
service ch
ecks
Stops acceptance of passive service check results found in external command file.
All p assive check results found are ignored.
Disable event handlers Temporarily stops host or service event handlers.
Start obsessing over
services
Tells Nagios to start obsessing over service checks. Read the documentation on
distributed monitoring for more information.
Enable fla
p detection
Enables fl
ap detection for hosts and services on program-wide basis. Individual
hosts and serv ices might have flap detection disabled.
Disable failure prediction Disables failure prediction for hosts and services on program-wide basis.
Disable performance
data
Disables processing of performance data for hosts and services on program-wide
basis.
Nagios S
tats
This vie
w provides information about service monitoring performance. The gray-box heading for this view
is Per fo
rmance Information.
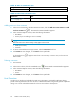
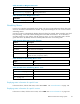
Table 55 Nagios Stats view features
Feature
Descrip
tion
Time Frame/ Checks
Completed
Number and percentage of PCC services checked in each indicated time frame
(since PCC startup or in the last 1, 5, 15, or 60 minutes).
Metric/Min/Max/
Average
• Check Ex ec ution Time
• Check Latency
Minimum, maximum, and average times:
• it took to check a service
• between time a service check was scheduled and time it was executed
(PercentStateChangeisnotused.)
The Passive Service Checks charts are not used; all PCC service checks are active.
Related Views
•
"Hostgroup Information" on page 98 presents the same monitoring performance information, but
for a single host g roup (and you can execute host group commands ).
• "Tactical Monitoring" on page 55 also provides limited information about monitoring
performance.
68
Platform Control Center (PCC)