11
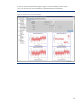
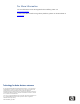
Figure 9 shows the same data as displayed in Figure 8, this time % Idle CPU for the past 7 days is
sampled in hourly intervals. This graph in Figure 9 has fewer data points than the graph in Figure 8.
Figure 9. Performance Graph Hourly Sample Rate