
Systems Insight Manager 6.1 User Guide

12 Monitoring systems
Viewing system collections
In Systems Insight Manager monitoring systems involves Systems Insight Manager polling
HP Insight
Management Agents
or firmware on the managed systems to retrieve status information, and then displays
this information as status icons. There are several types of status that can be displayed, such as Health Status
(HW), Software Versioning Status (SW), or Management Processor status (MP). Other status icons might be
added by plug-ins to Systems Insight Manager. These icons enable you to see, at a glance, the state of your
systems.
Pages displaying system status
• System lists There are four system lists page views; table view, icon view, tree view, and picture view
(for racks and enclosures). Common in each view is the system name and system status. To access the
system list pages, select a collection or system from the System and Event Collections panel. The
type of collection or system that you select determines the view that appears.
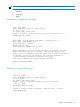
• Table view The HS column on the system list page displays the overall
system health status
,
which is determined by the default Hardware Status Polling task and is a roll up of all the status
sources, which can be SNMP, WBEM, HTTP, and cluster status. The legend shows how many
systems in the view are Critical, Major, Minor, Normal, Disabled, and Unknown.
• Icon view The icon view lists the system name of all discovered systems, as well as the
system
health status
for each system. The legend shows how many systems in the view are Critical, Major,
Minor, Normal, Disabled, and Unknown.
• Tree view The tree view displays the health status icon and the system name for each system in
a tree format.
• Picture view The picture view page for racks and enclosures contains a picture view of the
discovered systems in the rack or
enclosure
if available. While signed in to Systems Insight
Manager, placing your cursor over a server shown in the view displays information on that
particular server, including
server blade
name, slot number, and the enclosure in which the server
is located. You can also click a component name to display detailed information about the
component.
In all views, you can select the checkbox next to the system name to select a system. You can select
more than one system, or to select an entire collection, select the checkbox, Select "collection
name" itself.
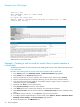
• System pages On the System Page, System tab, a status icon indicates the overall health status
stored in the
database
. If system monitoring is suspended, a disabled icon appears in place of the
hardware status icon and software status icon. The System Status section contains more information
on the
system
status.
You can access the System Page one of the following ways:
• Select Tools→System Information→System Page, and then select a target system.
• Click the system name in the System Name column on the system table view page.
• Property pages The Property page Status tab displays WBEM properties that help determine the
status of the target system, such as determining memory status and process status. Computer system
Viewing system collections 41