
HP-UX HB v13.00 Ch-22 - Performance and Tuning

HP-UX Handbook – Rev 13.00 Page 12 (of 19)
Chapter 22 Performance & Tuning
October 29, 2013
Disk I/O
Disk I/O efficiency is effected by a number of factors:
The amount of reads and writes pending in the run queue
The cumulative load on the controller, and it’s maximum capacity
The amount of buffer/file cache available
The size of I/O’s
Mount options
Patch level
Memory contention
CPU resources
To determine Disk I/O load , the system activity reporter is a good starting point, to obtain a
statistically significant sample it is prudent to gather data over sufficient time:
Example :
sar –d 5 100
This will provide sufficient granularity and averages to determine initial issues
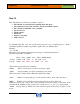
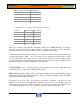
The final output will look similar to :
device %busy avque r+w/s blks/s avwait avserv
Average c2t6d0 1.50 0.51 4 66 0.06 6.31
Average c7t0d2 2.62 19.58 122 15023 3.44 1.27
These fields represent the key load metrics :
%busy Portion of time device was busy servicing a request
avque Average number of requests outstanding for the device
The normal value for this is 0.50 or half of the SCSI queue depth.
r+w/s Number of data transfers per second (read and writes) from and to the device
blks/s Number of bytes transferred (in 512-byte units) from and to the device
When this exceeds 512 , I/O by file system should be assessed in Glance to determine if the
cache threshold (256KB) is being exceeded. If so adjust discovered _direct_iosz appropriately.
avwait Average time (in milliseconds) that transfer requests waited idly on queue for the
device