
Getting started with HP-UX Workload Manager


52
Monitoring HP-UX Workload Manager
For monitoring WLM, there are several methods, some of which are described in the following
sections.
ps [-P] [-R workload_group]
The ps command has options that are specific to HP Process Resource Manager (PRM), which WLM
uses to define workload groups:
• -P
Adds the column PRMID, showing the workload group for each process.
# ps -P
PRMID PID TTY TIME COMMAND
SalesGrp 6462 ttyp1 4:34 report_maker
• -R workload group
Lists only the processes in the group named by workload_group. The following output shows
processes in the workload group SalesGrp:
# ps -R SalesGrp
PID TTY TIME COMMAND
6462 ttyp1 4:34 report_maker
6533 ttyp1 6:41 sales_tracker
wlminfo
The wlminfo command, available in /opt/wlm/bin/, displays information about SLOs, metrics,
workload groups, virtual partitions, nPartitions, and the current host. The following is an example
showing workload group information:
# /opt/wlm/bin/wlminfo group
Workload Group PRMID CPU Shares CPU Util Mem Shares Mem Util State
OTHERS 1 49.00 0.00 16.00 2.10 ON
FinanceGrp 2 15.00 0.00 12.00 34.43 ON
SalesGrp 3 31.00 19.57 60.00 4.89 ON
MarketingGrp 4 5.00 0.00 12.00 0.00 ON
Based on the output, the only group with any CPU activity is SalesGrp. The “Mem Util” column is a
new feature as of WLM A.03.02. Another new feature is that you can use the –v option with the
wlminfo group command to display the minimum and maximum CPU and memory allocations, if
they are assigned in the active WLM configuration file.
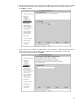
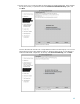
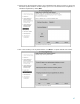
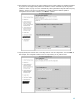
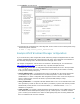
The wlminfo utility also has a graphical interface. To use this interface, use the -i option:
# wlminfo -i
This interface is also accessible from the wlmgui command.
Clicking the Monitor tab, you can see graphs on resource allocation for one or more workload
groups. By default, “CPU Shares” and “CPU Usage” are graphed for the selected groups. For an
example of the graphical user interface Monitor screen, see the “Providing CPU resources as needed”
section on page 14.