
HP Caliper 5.3 User Guide (5900-1558, February 2011)
The report shows measured data by thread, load module, function, source statement, and instruction
bundle.
Command-line options allow you to control the amount of data reported, how the data is sorted,
and the number of statements and instructions reported for each sampled program location.
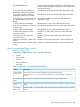
Example Command Line for Text Report
$ caliper cycles -ra -o reports/sample.txt ./wordplay thequickbrownfox
Example Command Line for CSV Report
$ caliper cycles --csv csvout ./wordplay thequickbrownfox
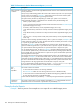
cycles Metrics Summed for Entire Run
This section describes the metrics summed over the entire run of your application under HP Caliper.
BACK_END_BUBBLE.FE Full pipe bubbles in main pipe due to front end. This is the
number of cycles lost (stall cycles) due to instruction cache,
ITLB, and branch execution stalls.
BE_EXE_BUBBLE.ALL Full pipe bubbles in main pipe due to execution unit stalls.
This is the number of cycles lost (stall cycles) due to stalls
caused by the execution unit.
BE_EXE_BUBBLE.FRALL Full Pipe Bubbles in Main Pipe due to FR/FR or FR/load
dependency stalls. This is the number of cycles lost (stall
cycles) due to FR/FR or FR/load dependency.
BE_EXE_BUBBLE.GRALL Full pipe bubbles in main pipe due to general
register/general register or general register/load
dependency stalls. This is the number of cycles lost (stall
cycles) due to general register/general register or general
register/load dependency.
BE_EXE_BUBBLE.GRGR Full Pipe Bubbles in Main Pipe due to GR/GR dependency
stalls. This is the number of cycles lost (stall cycles) due to
GR/GR dependency stalls.
BE_FLUSH_BUBBLE.ALL Full Pipe Bubbles in Main Pipe due to pipeline flushes. This
is the number of cycles lost (stall cycles) due to branch
misprediction or exception/interruption flush.
BE_L1D_FPU_BUBBLE.L1D Full Pipe Bubbles in Main Pipe due to L1D cache. This is the
number of cycles lost (stall cycles) due to L1D cache and
L1/L2 DTLB.
BE_RSE_BUBBLE.ALL Full Pipe Bubbles in Main Pipe due to RSE stalls. Percentage
of cycles lost due to stalls in RSE spilling/filling registers
to/from memory.
CPU_CPL_CHANGES.ALL Number of Privilege Level Changes to/from all privileges.
CPU_OP_CYCLES.ALL Number of elapsed CPU operating cycles. (Note: This event
is called CPU_CYCLES on Itanium 2 systems.)
When HyperThreading is on, this is the number of elapsed
CPU operating cycles used by only this process's
hyperthread.
CPU_OP_CYCLES.ALL:all_threads=true Number of elapsed CPU operating cycles used by both
hyperthreads. Available only when HyperThreading is on.
% Unstalled execution (higher is
better)
Percentage of unstalled cycles with respect to total number
of elapsed CPU operating cycles.
% of Cycles lost due to front end
stalls (lower is better)
Percentage of cycles lost due to I-cache, ITLB, and branch
execution stalls.
184 Descriptions of Measurement Reports