
HP Caliper 5.3 User Guide (5900-1558, February 2011)
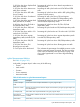
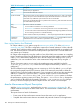
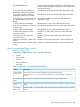
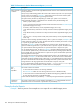

Table 20 Information in cycles Measurement Reports (continued)
DescriptionColumn
Routine from your application.Function
Source file associated with a function.File
The average number of cycles elapsed to retire the bundle. If there are no stalls, it should take
exactly one cycle to retire a bundle. If the Cycles Per Bundle information is more than 1, this
means that many additional cycles of stall were seen on that bundle.
If the Cycles per Bundle information is prefixed with an asterisk (*), that means that instructions
from that bundle are split issued.
Cycles Per Bundle
The column contains one of these:
• A source-code line number for rows showing statements
• An instruction slot number for rows showing instructions not on a bundle boundary
• A source-code column number followed by an offset from the beginning address of a function
for rows showing instructions on a bundle boundary
Column and line numbers are preceded by “~” when they are approximate due to optimization.
Line |
Slot |
Col,Offset
The column contains either a source statement preceded by “>” or a disassembled instruction.
Statements that are out of order due to optimization are preceded by “*>”.
>Statement |
Instruction
How cycles Metrics Are Obtained
HP Caliper obtains cycles metrics using the execution trace buffer (ETB) of the performance
monitoring unit (PMU). The ETB is configured to capture IPs of retired instructions. When a bundle
is retired, the IP address and the number of elapsed cycles to retire the bundle are recorded in the
ETB. The dual-core Itanium 2 and Itanium 9300 quad-core processor ETB is a circular buffer and
can contain up to 16 entries.
HP Caliper takes samples by using the overflow of one of the PMU's event counters as a sampling
trigger. Samples are taken every Nth PMU event, where both N and the sampling event are defined
in the cycles measurement configuration file in the HP Caliper home directory in the config
subdirectory. You can override the value in the measurement configuration file by using the -s
option.
The list of processor metrics you can use for the sampling event are available from the file
itanium2_cpu_counters.txt, located in the HP Caliper home directory in the doc/text
subdirectory.
The ETB collected at each sampling point can contain up to 16 IPs. By default, cycles will pick
the youngest IP sample from the ETB. However, all the 16 IP entries are processed to collect the
elapsed cycles (Cycles Per Bundle) information. If two consecutive IP entries have the same bundle
address, it is treated as a split issue (that is, it required multiple cycles to issue that bundle).
You can use the --etb-freeze-delay and --etb-walkback-cycles options to correlate
the performance monitoring events to IP values. The option --etb-freeze-delay changes the
way in which the ETB collects the IP samples. The option --etb-walkback-cycles changes
the way in which HP Caliper picks the IP sample from the 16 IP entries in an ETB sample.
dcache Measurement Report Description
With the dcache measurement, produced by the dcache measurement configuration file, HP
Caliper measures and reports on data cache metrics. This measurement is similar to the icache
measurement.
The report shows two levels of information:
• Exact counts of data cache metrics summed across the entire run of an application
• Sampled data cache metrics that are associated with particular locations in the application
186 Descriptions of Measurement Reports