
HP Caliper 5.3 User Guide (5900-1558, February 2011)
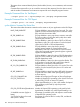
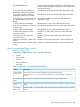
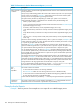

Table 21 Information in dcache Measurement Reports (continued)
DescriptionColumn
The latency data is reported under eight different buckets: three for cache information and five for
memory information.
The top row(s) of the heading specifies the names of the cache level (such as L2 or L3) and system
memory names. For example, in Example 5, cache levels L2 and L3 are shown and the system
memory is shown as simply Memory (spanning five buckets).
The system memory buckets vary depending on whether your system is a low-end server,
direct-connected cell system, or Superdome server. Possible memory bucket headings are:
• Memory: System memory access
• loc c2c: Local cache-to-cache (C2C) transactions between CPUs in the same front side bus (FSB)
(Superdome Integrity server only)
• loc memory: Cell local memory access (Superdome Integrity server only)
• 1 hop: Remote memory access that is one hop across the crossbar (Superdome Integrity server
only)
• 2 hop: Remote memory access that is two hops across the crossbar (Superdome Integrity server
only)
• 1&2 c2c: One- or two-hop cache-to-cache (C2C) remote memory access (Superdome Integrity
server only)
The last row of the headings specifies the latency value in cycles. For example, in Example 5, the
L2 data cache has a latency of 7 cycles. All data cache misses with latency of less than or equal
to 7 cycles are grouped under the L2 bucket.
The buckets in Example 5 under L3 have latencies of 14 and 64 cycles. The bucket under 14
captures all latencies greater than 7 cycles and less than or equal to 14 cycles. The bucket under
64 captures latencies that are greater than 14 cycles and less than or equal to 64 cycles.
On an rx4640 Integrity server, as shown in Example 5, the last five buckets capture misses that
are serviced from system memory. The first bucket under the Memory heading captures latencies
that are greater than 64 cycles and less than or equal to 150 cycles. The last bucket captures all
latencies greater than 450 cycles.
The reported values are the percentage of sampled dcache misses in the specified latency range.
For example, in Example 5, in the Function Totals column, the value of 92 in the L2 data cache
means that 92 percent of all data misses in the function goo are satisfied by the L2 cache. Similarly,
the value in the first bucket under the Memory heading means that 5 percent of the misses were
having latencies in the range greater than 64 and less than or equal to 150 cycles.
If you turn off the latency bucket information by using the --latency-buckets False option,
the information in the Latency Buckets as % Misses column is not displayed.
Latency Buckets as
% Misses
The column contains one of these:
• A source-code line number for rows showing statements
• An instruction slot number for rows showing instructions not on a bundle boundary
• A source-code column number followed by an offset from the beginning address of a function
for rows showing instructions on a bundle boundary
Column and line numbers are preceded by “~” when they are approximate due to optimization.
Line |
Slot |
Col,Offset
The column contains either a source statement, preceded by “>”, or a disassembled instruction.
Statements that are out of order due to optimization are preceded by “*>”.
>Statement |
Instruction
Example dcache Reports
Example 5 shows a portion of an example dcache report for an rx4640 Integrity server.
190 Descriptions of Measurement Reports