
HP Caliper User Guide Release 5.5 (5900-2351, August 2012)

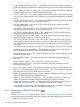
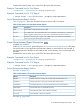
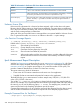

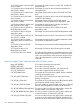

Table 25 Information in Per-Source-File fcover Measurement Reports
DescriptionColumn
“Yes” or “No” indication of whether the named function was ever executed.Reached
Name of the function. The load module, main executable or shared library, containing
the function precedes the function name and is separated from it by “::”.
Function
Base source file name, without path information, and starting line number of the named
function. The tilde (“~”) precedes line numbers when they are approximate due to
optimization.
Source File [Line]
Unknown Source Files
If the source file information for a function has been stripped, which is often done with system
libraries, then HP Caliper reports on those functions separately. The report shows an additional
line in the Source Directory Summary and Source File Summary tables for Unknown Source Files
and the Totals coverage statistic includes them.
At the end of the per-source-file function coverage tables is an optional table for Unknown Source
Files. To generate this table, use unknown in addition to the other -r option settings.
-r for Function Coverage Reports
-r [module][:directory][:file][:function][:unknown][none][all]
Default value is module:directory:file:function:unknown.
module Shows data by load module.
directory Groups data by source directory.
file Generates Summary Report by source file.
function Shows function level detail by source file.
unknown When used together with the other report options, provides additional information
about functions from unknown source files in the summary and detail coverage
reports.
fprof Measurement Report Description
With the fprof measurement, produced by the fprof measurement configuration file, HP Caliper
measures and reports sampled instruction pointers (IPs). The fprof measurement samples the
instruction pointer (IP) at a regular interval (that is, at a particular number of CPU cycles). This
provides a statistical identification of where CPU events are occurring.
The report contains two levels of information:
• Exact counts of CPU metrics summed across the entire run of an application
• Sampled IPs that are associated with particular locations in the application
The default for the fprof measurement is to take a sample every 500,000 +/- 25,000 CPU
cycles. (CPU_CYCLES is the event.)
You use the -s (--sampling-spec) option to change both the event being sampled and the
interval. For example, if you want to keep the same variation and sample event and simply change
the interval, you can use the following option: -s 100000. The sampling rate, variation, and
event used are listed in the Sampling Specification part of the report.
Command-line options allow you to control the amount of data reported, how the data is sorted,
and the number of statements and instructions reported for each sampled program location.
Example Command Line for Text Report
$ caliper fprof -o reports/sample.txt ./wordplay thequickbrownfox
208 Descriptions of Measurement Reports