
HP Process Resource Manager User's Guide

Administering PRM
Monitoring PRM groups
Chapter 9184
Monitoring PRM groups
To monitor and verify your PRM configuration, use the prmanalyze,
prmconfig, prmlist, prmmonitor, id, acctcom, or ps commands or the
GlancePlus product.
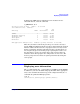
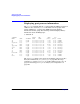
Sample prmmonitor output is shown below:
Tue Mar 21 14:36:42 2000 Sample: 5 seconds
CPU scheduler state: Enabled
CPU CPU
PRM Group PRMID Entitlement Used
____________________________________________________________
OTHERS 1 20.00% 20.08%
databases/inventory 2 10.00% 10.04%
databases/order 3 20.00% 19.88%
development 4 40.00% 39.96%
mailserver 5 10.00% 10.04%
PRM application manager state: Enabled (polling interval: 30 seconds)
Logging PRM memory messages
You can log PRM memory messages to a file. These messages contain
information similar to that of the prmmonitor command. Logging
generates messages for every polling interval and can consume a large
amount of disk space. For information on changing this interval, see
“Setting the memory manager’s polling interval” on page 180.
Messages are logged in the file /var/adm/syslog/syslog.log.
You can control the logging of PRM memory messages on the command
line as discussed in the following section. You can also control logging in
the PRM interface in HP System Management Homepage or in HP
Systems Insight Manager.