
HP Process Resource Manager User's Guide

Administering PRM
Displaying user information
Chapter 9 187
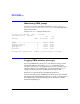
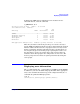
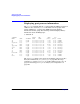
To display the PRM memory and CPU resource statistics for one
30-second interval, enter the command:
# prmmonitor 30 1
Tue Mar 21 15:08:19 2000 Sample: 30 seconds
CPU scheduler state: Enabled
CPU CPU
PRM Group PRMID Entitlement Used
____________________________________________________________
OTHERS 1 20.00% 20.00%
databases/inventory 2 10.00% 9.98%
databases/order 3 20.00% 20.00%
development 4 40.00% 40.00%
mailserver 5 10.00% 10.02%
PRM application manager state: Enabled (polling interval: 30 seconds)
There may be instances when the percentage of a resource used by a
specific PRM group differs from the percentage derived from its assigned
number of shares for that resource. A group’s resource use may be less
than it is entitled to when the demand is not there, meaning there are
not enough ready processes in that group requesting the resource. On
the other hand, a group can consume more of the resource than it is
entitled to when other groups in the configuration are not active. The
inactive group’s resource shares are split up automatically among the
active groups.
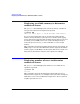
Displaying user information
The id command with the -P option prints your PRM group ID (PRMID)
in addition to your user ID (UID) and group ID (GID). If the appropriate
entry can be found in the internal copy of the configuration file, the id
command also prints the PRM group name.
# id -P
uid=411(user1) gid=200(group1) prmid=3(finance)