
HP XC System Software Administration Guide Version 3.2


7 Monitoring the System
System monitoring can identify situations before they become problems. This chapter addresses
the following topics:
• “Monitoring Tools” (page 87)
• “Monitoring Strategy” (page 88)
• “Displaying System Environment Data” (page 89)
• “Monitoring Disks” (page 90)
• “Displaying System Statistics” (page 90)
• “Logging Node Events” (page 92)
• “The collectl Utility” (page 94)
• “HP Graph” (page 97)
• “The resmon Utility” (page 101)
• “The netdump and crash Utilities” (page 102)
7.1 Monitoring Tools
Tools for monitoring the HP XC System Software include the following:
• Standard Linux monitoring commands:
— ps
— sar
— top
— uptime
— vmstat
— w
You can use these administrative commands from any node to determine the health of an
individual node. Information for these commands is available from their corresponding
manpages.
• Utilities developed by HP:
— The collectl utility. See “The collectl Utility” (page 94) for more information.
— The HP XC shownode metrics command, which can be issued from any node in the
HP XC system, provides the ability to monitor the status of all the nodes in the system.
These arguments to the shownode metrics command monitor the node status:
◦ shownode metrics cpus
◦ shownode metrics cputotals
◦ shownode metrics load
◦ shownode metrics mem
◦ shownode metrics paging
◦ shownode metrics sensors
◦ shownode metrics swap
For more information, see “Displaying System Statistics” (page 90) and shownode(8).
• Externally developed software:
— The Nagios Web-based utility displays a series of windows that provide system statistics.
Chapter 8 (page 105) discusses Nagios.
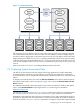
— Supermon is a highly scalable, high-speed cluster monitoring system. Supermon provides
all required node statistics to the Nagios subsystem. System statistics are tiered,
aggregated, and stored in the configuration and management database (CMDB)s.
7.1 Monitoring Tools 87