
HP StorageWorks P9000 Performance Advisor Software v5.4 Troubleshooting and FAQs Guide (T1789-96336, April 2012)
From P9000 Performance Advisor v5.0 onwards, default threshold value is also provided for the MP
blade Util (%) metric (applicable only for P9000 disk arrays), which is 70%.
In addition to providing the threshold values for the other Frontend, Cache, Backend, and MP blade
metrics, you can retain the default values or provide values of your choice for the above mentioned
metrics. The status of resources for the above mentioned metrics is derived based on the default or
threshold values that you set, and displayed on the Troubleshooting screen.
Configuration and performance data collections
I've added another XP disk array as an external storage to my XP24000. Will
I see the external storage related data if I perform an Inband mode of configur-
ation data collection?
No. Inband mode of configuration data collection does not get data on the external storage. Use
Outband mode of configuration data collection to get data on external storage.
After a configuration data collection, the last collection time stamp in the Array
View screen is not updated. Why?
The last collection time stamp is not updated for a configuration data collection. Only a confirmatory
message indicating a successful configuration data collection is displayed in the Event Log screen.
However, if you initiate a performance data collection, the last collection time stamp is updated once
the frequency of collection for the individual resources is complete. For example, if a performance
data collection is initiated at 9:47 AM for a frequency of 5 minutes, the last collection time stamp is
updated only after the 5 minutes completes.
I have added a command device from SLPR1. Can I collect information through
that command device for LUNs presented through other SLPRs?
No. If you add a command device from SLPR1, that command device collects information only for
the LUNs presented through SLPR1. However, if you add a command device from SLPR0, it collects
data from all the LUNs presented through SLPR0. In addition, the command device also collects data
from LUNs presented through associated SLPRs, such as SLPR1, and SLPR2.
I've set the frequency of collection as 5, 10, and 15 minutes for DKC, port, and
RAID groups. The DKC time stamp is getting updated while I am observing that
the port time stamp is not getting updated. Why?
The last collection time stamp get updated based on the performance data collection frequency set
for each individual resource. Since the frequency set for DKC is 5 minutes, it appears first. The last
collection time stamp for port data collection gets updated only after 10 minutes duration.
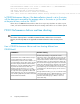
Why did the Windows GUID on my management station change after I rebooted
the management station?
When the management station is rebooted, the command device configured as the Windows GUID
automatically stops collecting data, as it is no longer considered as the GUID that can interact with
P9000 Performance Advisor. In such a case, configure another command device as the GUID or
recreate the same command device that previously changed, and configure it as the GUID. The Event
Log and the PerformanceAdvisor.log contain similar messages as follows:
HP StorageWorks P9000 Performance Advisor Software Frequently Asked Questions 69