
HP StorageWorks P9000 Performance Advisor Software v5.4 Troubleshooting and FAQs Guide (T1789-96336, April 2012)
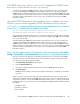
The zoom preview panel has sliders that you can use to filter the overall duration in the chart
window and view data for a particular focused duration. You can drag the sliders on either side
of the time scale to increase or decrease the duration for which you want to view the data points.
The existing chart window are accordingly updated to display data points for the duration selected
in the Zoom preview panel. The focused area in the Zoom preview panel is highlighted in blue.
It shows the section of the chart window that you are currently viewing in the Zoom preview panel.
The Zoom preview panel is always in sync with its chart window and dynamically updated
whenever you change the duration in the chart window.
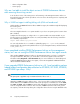
• Vertical and horizontal zoom, where you zoom into charts for a specified duration and also across
data points in the chart. If the zoom preview panel is enabled, it highlights the focused area in
the chart window. To zoom in on data points in a chart, hold down the mouse button, drag the
pointer across the data points that you want to focus on. The chart window displays the focused
set of data points. The sliders on the zoom preview panel automatically shift the focus to the selected
set of data points. The focused area is highlighted in blue, in the Zoom preview panel.
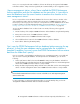
When can I add new chart windows to the Chart Work Area?
By default, performance graphs of resources are plotted in the same chart window for metrics that
belong to the same metric category. If you want to view their performance graphs in separate chart
windows, do the following:
1. Click Add New to add a new chart window to the Chart Work Area. The new chart window is
automatically selected.
2. Clear the selection of the active chart window in the Chart Work Area, by clicking the chart title
bar. Then, select the resource or metric under Charts. The subsequent performance graphs of
resources for metrics belonging to the same metric category are automatically added to the new
chart window. This continues till you clear the selection for the new chart window.
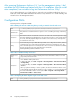
Why is it that the Choose Metrics box is disabled when I click the Cache node
for one of the XP or P9000 disk arrays under Charts?
The Choose Metrics box is disabled when you click the Cache node, because the configuration data
collection is not yet performed for your XP or P9000 disk array, and the CLPR partition data is not
available with P9000 Performance Advisor. Perform configuration data collection for your XP or a
P9000 disk array to view the Cache related metrics in the Choose Metrics box.
Why are the virtual volumes like ThP or snapshot pool volumes not displayed
for my XP or a P9000 disk array?
The virtual volumes like ThP or snapshot pools are displayed only if those resources can be configured
on your XP or a P9000 disk array. Therefore, verify if your XP or a P9000 disk array supports virtual
volumes to be configured.
Does the Legends check box selection in the individual chart windows override
the Show Legends check box selection in the Chart Work Area?
Yes. If the Legends check box is selected in the individual chart window, it supersedes the Show
Legends selection in the Chart Work Area.
HP StorageWorks P9000 Performance Advisor Software Frequently Asked Questions 81