
HP XP P9000 Performance Advisor Software v5.5 User Guide (T1789-96337, Februrary 2013)

NOTE:
• For the Raid Group, the Host Group branch is traversed first, followed by the Pool branch,
Back-end, and finally the Drive Types branch.
• You can search for External Raid Groups as well by selecting Raid Group from the component
drop-down list and querying for a specific External Raid Group.
• When searching for concatenated Raid groups, you should enter a part of Raid group name
and not the entire name. For example: If you want to search for concatenated Raid Group
"1-1 1-2", then enter either 1-1 or 1-2 in the search box, and click Find Next.
• For the Port, the Host Group branch is traversed first followed by the Front-end branch.
• For Host Group, the Host group is highlighted first in the host group branch followed by the
Pools branch.
◦ For performing search in the Host Group, you have to include the entire host group name.
If you want to search for Host Group PA-CVXPt2, then you have to type the entire name,
considering the case sensitivity to navigate in host groups and the Pools branches.
◦ If a part of the Host Group name is provided like CVX during the search for host group
PA-CVXPt2, then you can navigate only through the Pool branches.
• Pools are traversed in only pool and snap pool branches.
• When searching for LDEVs in the Host Group branches, only the LDEVs present in HostGroup
-> Ldevs branch is highlighted. The LDEVs present in HostGroup ->RG ->Physical Ldevs branch
and HostGroup ->RG ->Pool Ldevs branch is not traversed.
• Filtering is not supported for sub nodes that are under HostGroup->LDEVs->PVol, that is, filtering
is not supported for the components that are in S-Vols , S-Vols ->Pool-ID, S-Vols -> Pool-ID ->
Ldevs, S-Vols ->Pool-ID -> Ldevs -> RGs.
IMPORTANT:
• The search results are specific to an XP or a P9000 disk array. You cannot search for
components (LDEVS, RG, HG, POOL, PORT) physical LDEVs that are spread across multiple
XP and P9000 disk arrays.
• The search is not supported in custom group.
• Search does not support multiple entries. You can search only for one component (Ldev or RG
or HG or Pool or Port) at a time.
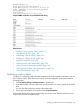
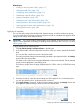
Managing alarms history
HP XP P9000 Performance Advisor maintains the history of alarms for components, if the alarms
are already configured and enabled on them. The history of alarms is displayed for the following
time stamps in the Alarms History table:
1. Time Posted: The time when the performance of a component went beyond or below the
threshold level, and a new record was posted. When a new record is added for a component
the first time, the Time Posted time stamp will be the time when an alarm was configured on
the component.
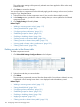
2. Time Updated: The last time when the component was monitored for change in performance
value (if the performance of a component exceeded or dropped below the set threshold level).
3. Time Dispatched: The time when the alarm notifications were dispatched. The current
performance value of a component is also displayed.
Initially, the message No records found matching the given filter criteria is displayed if there are
no component records posted in the Alarm History table.
130 Configuring alarms and managing events