
HP XP P9000 Performance Advisor Software v5.5 User Guide (T1789-96337, Februrary 2013)

• “Adding or removing metric values” (page 117)
• “Configuring notification and monitoring settings” (page 119)
Viewing events
HP XP P9000 Performance Advisor generates events in response to various activities that you
perform using this application. Appropriate records are automatically displayed for all the events
in the Event Log table. For instance, records are logged for events generated when a performance
data collection fails or the collection schedule is restarted. The Event Log screen is displayed when
you click Monitoring+Event Log in the left pane.
IMPORTANT: By default, the Event Log screen displays records for events that have been generated
in the last 24 hours.
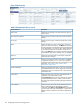
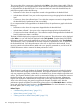
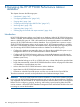
Event Log table, where all the events generated are
displayed.
1
The records logged contain the following details for an event:
• Time when the event was logged.
• Type of event logged.
• Severity of the event.
• Description.
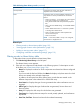
In addition, view the following details on the Event Log screen:
• Historic data (data older than 24 hours) by specifying a date range for viewing the data.
• Filter the event records based on severity and type of events generated.
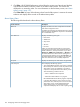
Click a column heading to sort the records based on that column. By default, columns are sorted
in ascending order. Click the column heading again to reverse the sort order. To navigate through
pages of event records, use Previous and Next buttons, or enter a page number of your choice in
the Go To box. Click Refresh to reload the Event Log page to view the updated set of records.
Tasks you can perform on the Event Log screen
• “Filtering event records” (page 138)
• “Deleting event records” (page 139)
Viewing events 137