
HP XP P9000 Performance Advisor Software v5.5 User Guide (T1789-96337, Februrary 2013)
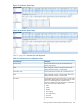
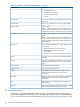
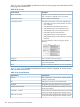
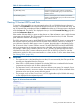
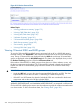
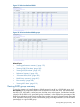
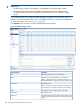
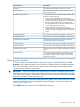
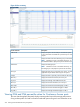

Figure 21 10 busiest backend LDEVs
Figure 22 10 busiest backend RAID groups
Related Topics
• “Viewing performance summary” (page 175)
• “Viewing CHIP/CHA data” (page 183)
• “Viewing ACP/DKA data” (page 187)
• “Utilization Summary” (page 181)
• “10 busiest LDEVs/Ports” (page 205)
• “RAID Group summary” (page 207)
• “Port summary” (page 209)
• “Viewing LDEV data” (page 212)
Viewing RAID group summary
To view the summary of overall utilization of RAID groups for an XP or a P9000 disk array, click
RG Summary in the component selection tree for that XP or P9000 disk array. This feature totals
the LDEV I/Os, LDEV MB/s, cache fast write, disk fast write, cache bypass, and backend transfer
values for all the LDEVs on a given RAID group. In addition, it also displays the percentage of the
RAID Group utilization random read, random write, random write parity, sequential read, sequential
write, sequential write parity, and the overall RAID group percentage utilization (sum of the above
percentages) on a given RAID group.
Viewing RAID group summary 207