
HP XP P9000 Performance Advisor Software v5.5 User Guide (T1789-96337, Februrary 2013)
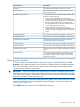

DescriptionScreen elements
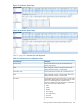
The total frontend throughput in MB/s for the LDEV.LDEV MB/s
The total number of backend tracks transferred to or from
the XP array backend.
Backend Transfer
* is displayed beside the combined backend transfer value
indicates one of the following:
Combined Backed Transfer
• If any of the physical LDEVs from a RAID group is
configured in multiple ThP pools, the sum of the backend
transfer on all the ThP pools will be shown as combined
backend transfer for that RAID group. (The backend
transfer of each ThP pool is the sum of backend transfer
on V-Vols belonging to that ThP pool).
• If physical LDEVs from multiple RAID groups are
configured in a ThP pool, the combined backend transfer
will be reported as an aggregate value for all the RAID
groups.
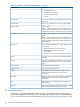
The random read utilization percentage for a RAID group.% RGUtil Rand Read
The random write utilization percentage for a RAID group.% RGUtil Rand Write
% RGUtil Random Write Parity The random write parity
utilization percentage for a RAID group.
% RGUtil Random Write Parity
The sequential read utilization percentage for a RAID group.% RGUtil Seq Read
The sequential write utilization percentage for a RAID group.% RGUtil SeqWrite
The sequential write parity utilization percentage for a RAID
group.
% RGUtil Seq Write Parity
The overall percentage utilization of a RAID group, which
is the sum of the random reads, random writes, random
Overall % RGUTIL
write parity, sequential reads, sequential writes, and the
sequential write parity.
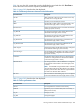
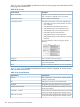
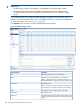
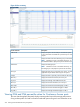
Viewing port summary
To view the summary of overall utilization of ports for an XP or a P9000 disk array, click Port
Summary in the component selection tree for that XP or P9000 disk array. This feature totals the
LDEV I/Os, LDEV MB/s, cache fast write, disk fast write, cache bypass, and backend transfer
values for all of the LDEVs on a given port.
IMPORTANT: When you request a port summary report, the total I/Os displayed may not be
equal to the sum of the I/Os across each of the ports. This can occur if multiple paths to an LDEV
exist. The port IO summary indicates the IO ceiling values across the ports. It does not indicate the
absolute or accurate I/O rates across the ports.
Click a CHP Port ID to view the associated performance graphs in the Chart Work Area. The port
type for the selected port ID is also displayed in the chart legends. For more information, see
“Plotting charts” (page 233).
Click Refresh when you want to view the updated port summary.
Viewing port summary 209