
HP XP P9000 Performance Advisor Software v5.5 User Guide (T1789-96337, Februrary 2013)
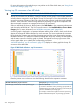
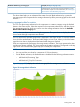
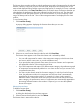

Example (see Figure 28 (page 274))MP blade utilization by processing types
indicates that 16.4% of the CPU cycles are utilized to process
the consumers requests. For more information, see “Viewing top
20 consumers of an MP blade” (page 272).
The above data helps you to understand the extent of an MP blade utilization by a particular
processing type when compared to the average utilization by all the processing types for the overall
duration.
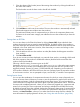
Viewing aggregate data for metrics
You can view the average utilization for the components in a metrics category using the Stacked
button in the Charts screen. Select the required in the component selection tree, and then choose
the appropriate metric for which you want to view the average utilization data in the Available
Metrics Choose Metric Category list.
NOTE: You can select a maximum of eight components. The system does not display the stacked
chart if more that eight components are selected.
The Line chart for the selected components is displayed in the Chart window. To view the stacked
chart, click the stacked button. The button label changes to Line Chart. When you click the button
again the Line chart is displayed and the button label changes to Stacked.
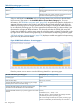
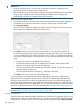
Each area represents the percentage of average metrics utilization. The X-axis represents the date
and the time duration selected. The Y-axis represents the metrics utilization. The legends on the top
right corner of the stacked area graph help you to identify the components.
NOTE:
• You can stack the area chart for a maximum of 12 hours duration.
• For MP Blades utilization, the Stacked button is disabled for the following utilization metrics:
◦ MP Blade Util/Processing Type
◦ MP Blade Util Top 20 Consumers
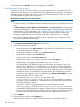
Figure 29 (page 275) displays the stacked area graph for the average metrics utilization.
Figure 29 Average Metric Utilization
Plotting charts 275