
HP XP P9000 Performance Advisor Software v5.5 User Guide (T1789-96337, Februrary 2013)

IMPORTANT:
• Using the favorite chart, you can only save components and metrics combination. The
performance metrics of components cannot be saved.
• Each favorite chart can accommodate components and metrics that belong to the same metric
category. The components and metrics that belong to a different metric category are
automatically considered as a separate favorite chart request.
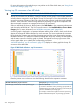
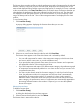
To save a chart as a favorite chart:
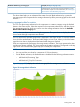
1. In the Chart Work Area, select the chart windows that have performance graphs plotted for
a combination of components and metrics, which you want to save as favorite charts.
2. Click Save Fav Chart(s).
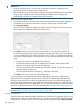
The Save Chart(s) dialog box appears. By default, the metric category titles of the respective
chart windows are displayed as the favorite chart names.
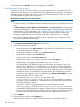
3. Click Save to save the selected charts as favorite charts. You can provide a name for the
favorite chart by clicking in the respective text box and entering the name. If you do not provide
a name, by default, the metric category title of the chart window is considered as the favorite
chart name. The following are a few points that you must note while specifying a favorite chart
name:
• The name should have only alphanumeric characters.
• The name should also begin with an alphanumeric character, which means the first
character in the name cannot be a special character.
• The name provided should be at least two characters in length. The maximum number of
characters being 50 characters.
• Only the special character, underscore (_) is allowed in the name.
Click Close if you do not want to save the selected chart.
If you save the new set of components and metrics (belonging to the same or different metric
categories) with an existing favorite chart name, the new set is automatically appended to the
existing set in the favorite chart. When you load that favorite chart, the performance graphs for
the corresponding components are segregated based on the metric categories to which the metrics
belong and displayed in the Chart Work Area. You can also save the new set of components and
metrics as a separate favorite chart. For more information, see “Loading favorite charts” (page 278).
NOTE: You can also generate, save, or schedule a report for your favorite chart. For more
information, see “Creating reports for favorite charts” (page 280).
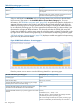
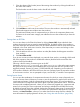
Loading favorite charts
A favorite chart when selected displays the performance data points of components for the current
duration that is active in the Chart Work Area. You can also view the performance of the selected
components for a duration of your choice by selecting the date and time using the Date/Time Filter.
278 Using charts